Google Ads Looker Studio Template
$199
This Google Ads Looker Studio report template saves a lot of time during everyday work with Google Ads search performance data.
Description
Table of contents
Why is the Google Ads interface not enough?
I like the Google Ads UX. It has many useful features. I use native Google Ads analytics to monitor the performance of all CPC campaigns.

However, using Looker Studio reports can make your everyday Google Ads routine more convenient. Here is how.
1. Google Ads has many performance metrics and it’s difficult to use all of them in one table
- Performance;
- Setup;
- Viewability;
- Conversions;
- Budget simulator;
- Attribution;
- Attributes;
- Competitive metrics;
- Google Analytics;
- Call details;
- Message details;
- YouTube Earned actions;
- Change History;
- Reach metrics;
- Gmail Metric.
By the way, many website owners, who have little experience with Google Ads, don’t know how to get value from these metrics. Looker Studio helps to combine these metrics to answer specific business questions. The ability to use many pages and many charts helps in that purpose.
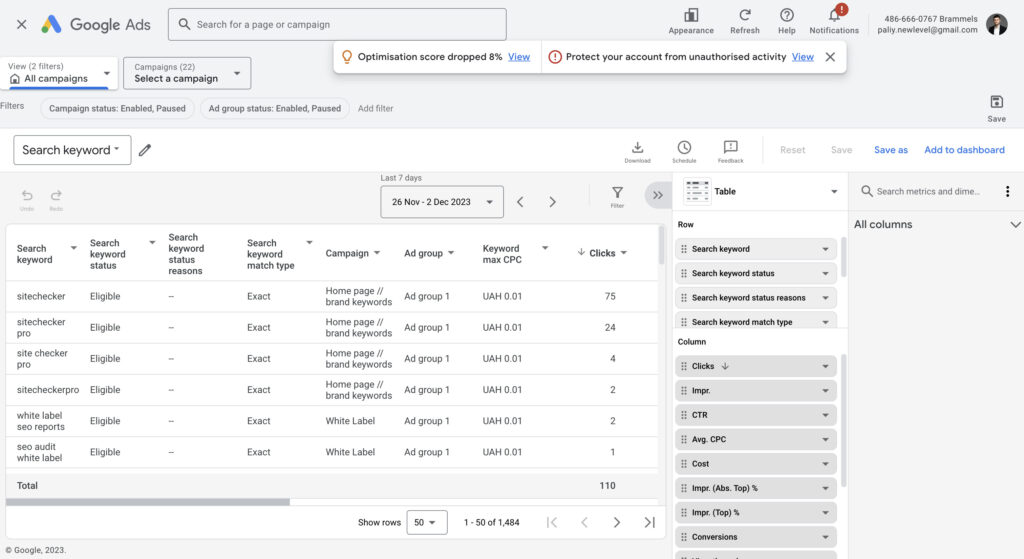
2. Google Ads has too limited features in chart building
You can build charts but only time series and summary charts. It’s not enough for analysis. Looker Studio has more chart types and the ability to customize tables and charts.

Some time ago, Google Ads added more features to extend the options in reporting building, but it is still limited. Below is an example of the Dashboard tool.

and an example of a Report editor. The Report editor is closer to the Looker Studio interface and opportunities but it is still not the same. The most important thing is that you can’t blend data from Google Ads with data from other data sources in this tool.
3. Looker Studio helps to customize reports for different types of Google Ads campaigns
For example creating a separate you can use specific reports for Search Ads, Display Ads, Video Ads, Google Shopping, etc.
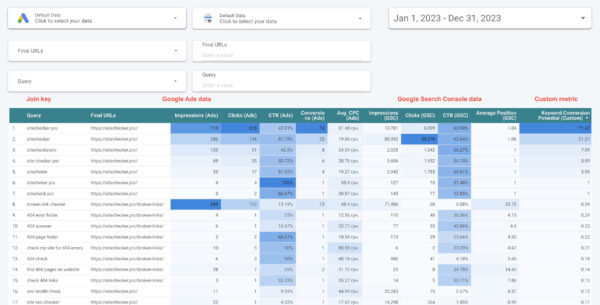
4. Looker Studio helps to compare paid campaigns from different PPC traffic channels
For example, you can build a report that contains data from Google Ads, Facebook Ads, YouTube Organic, LinkedIn Ads, Bing Ads, Twitter Ads.
And this is not the final list of reasons.
The structure of the Google Ads report template
This template has 6 pages. Google Ads connector and calendar work on a report level, choose them on one page and they will still be the same on the next pages.

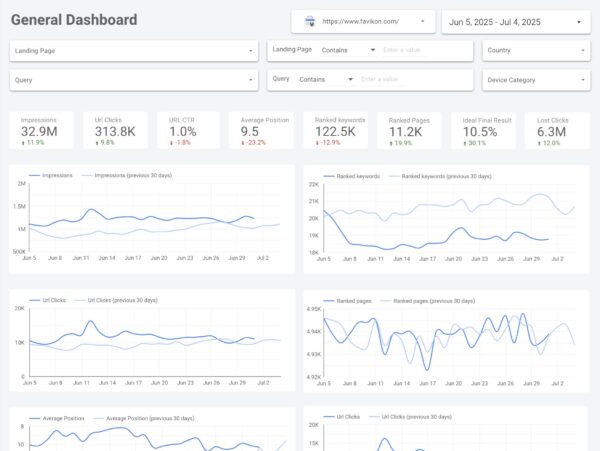
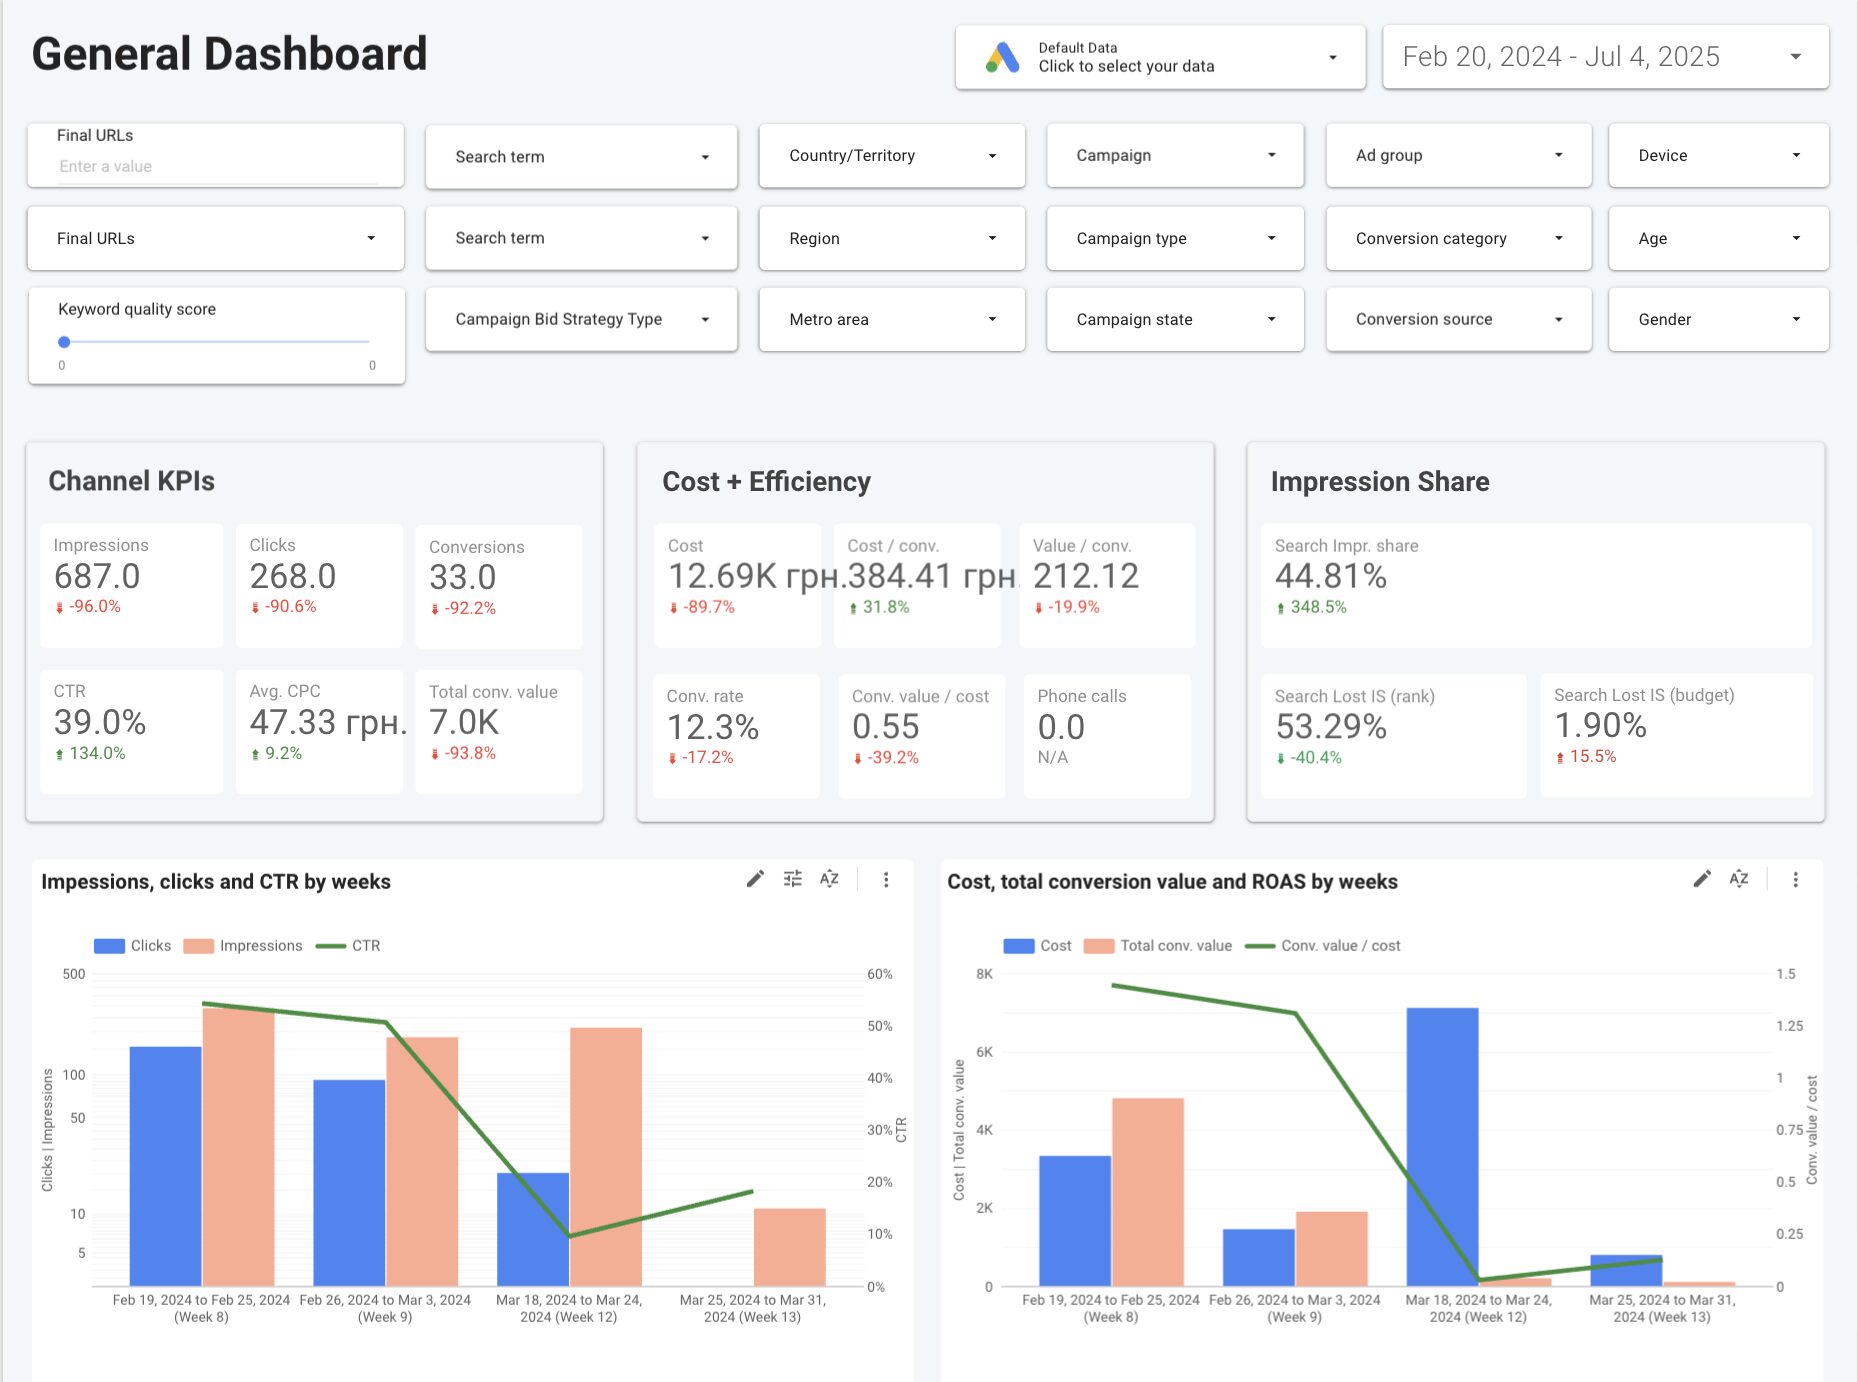
General Dashboard
The first part contains scorecards with the most important metrics and their comparison with the previous period. For example, if you choose the period This year, the comparison is made with the Last year.
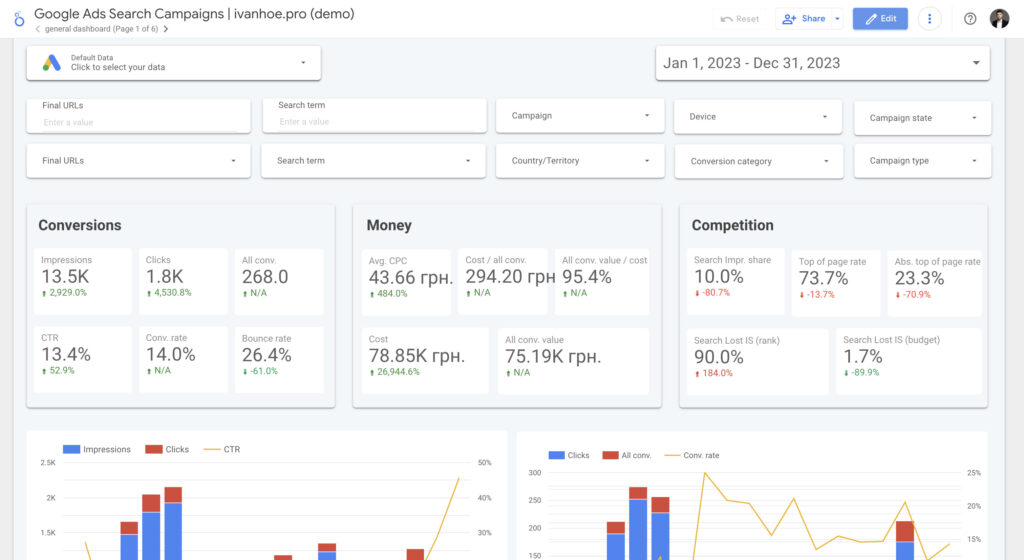
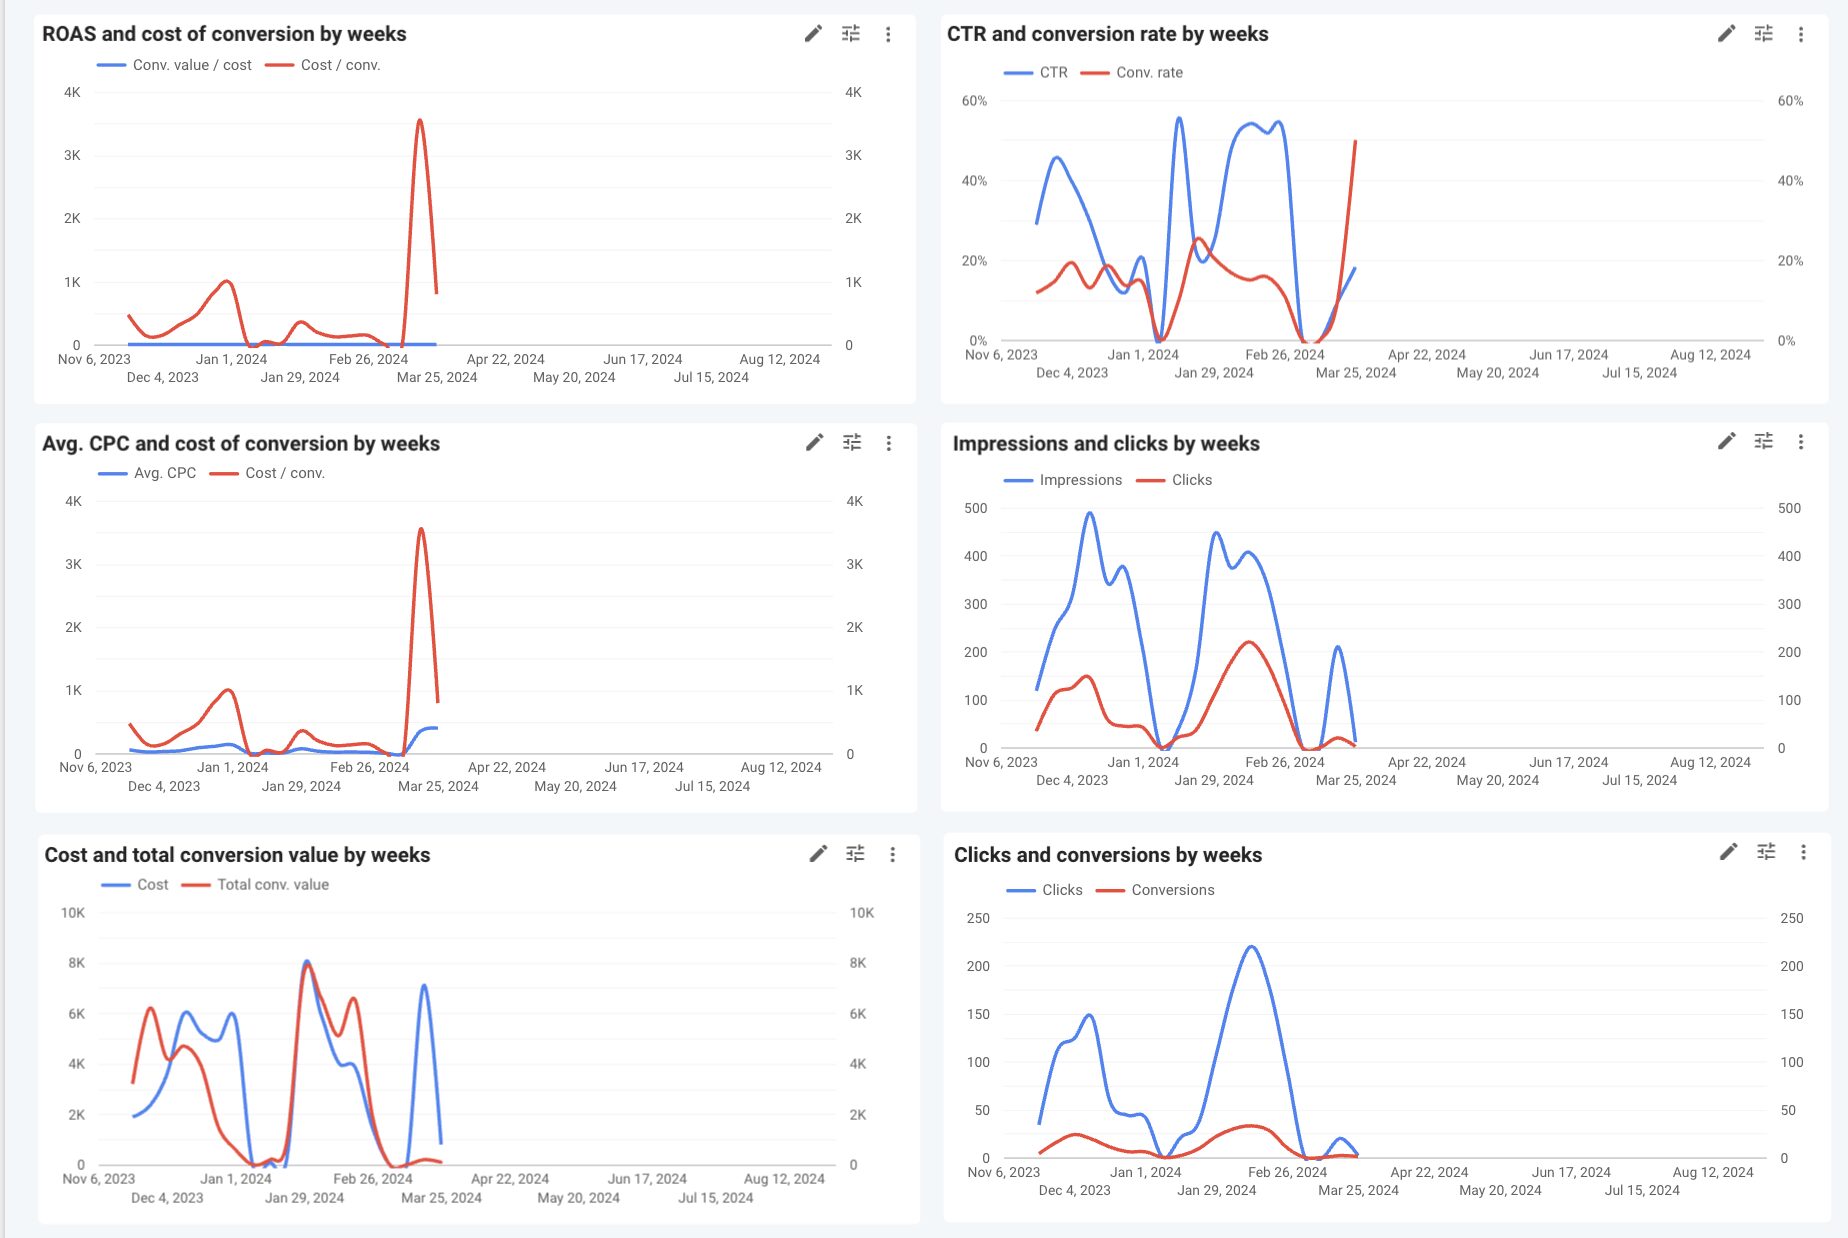
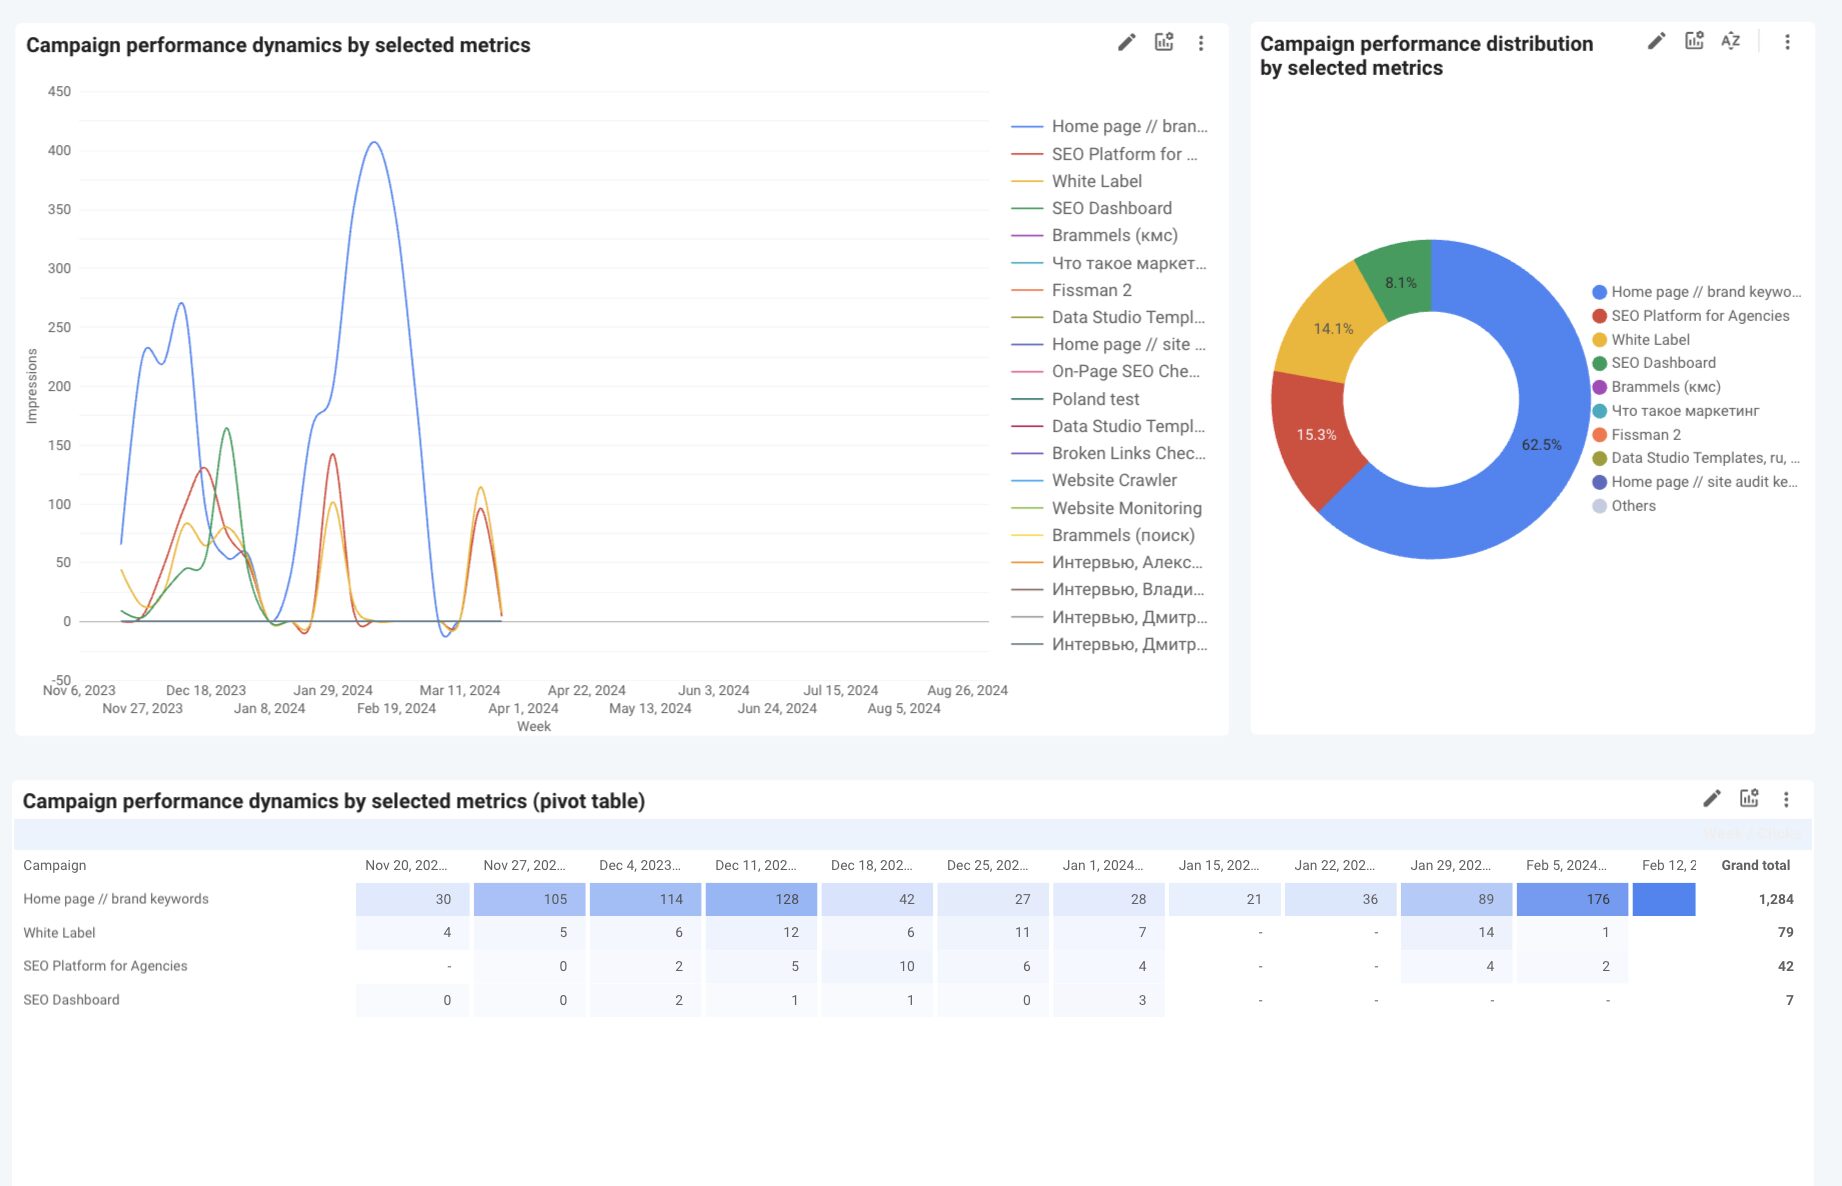
The second part contains a chart with dynamics by the most important metrics.
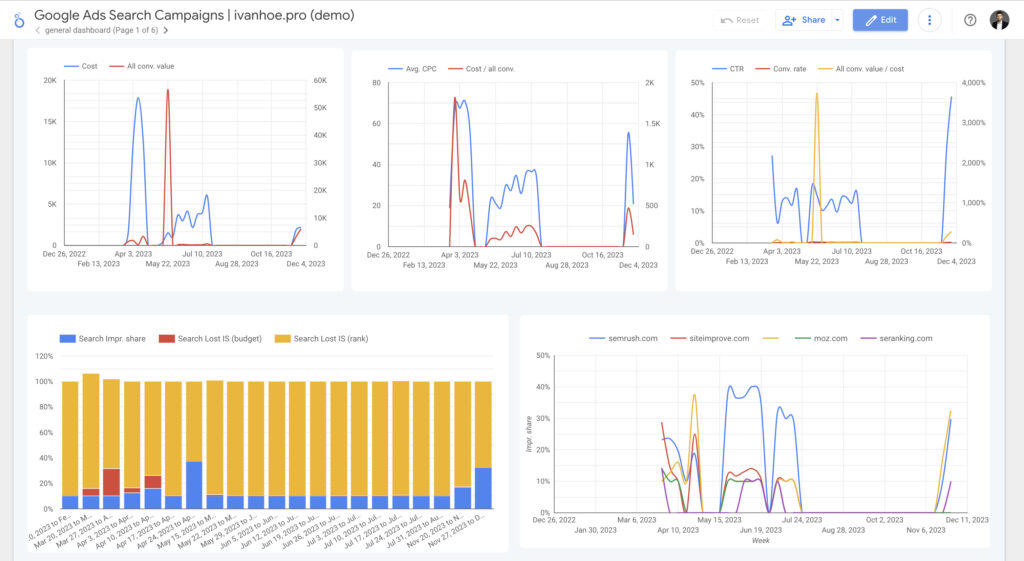
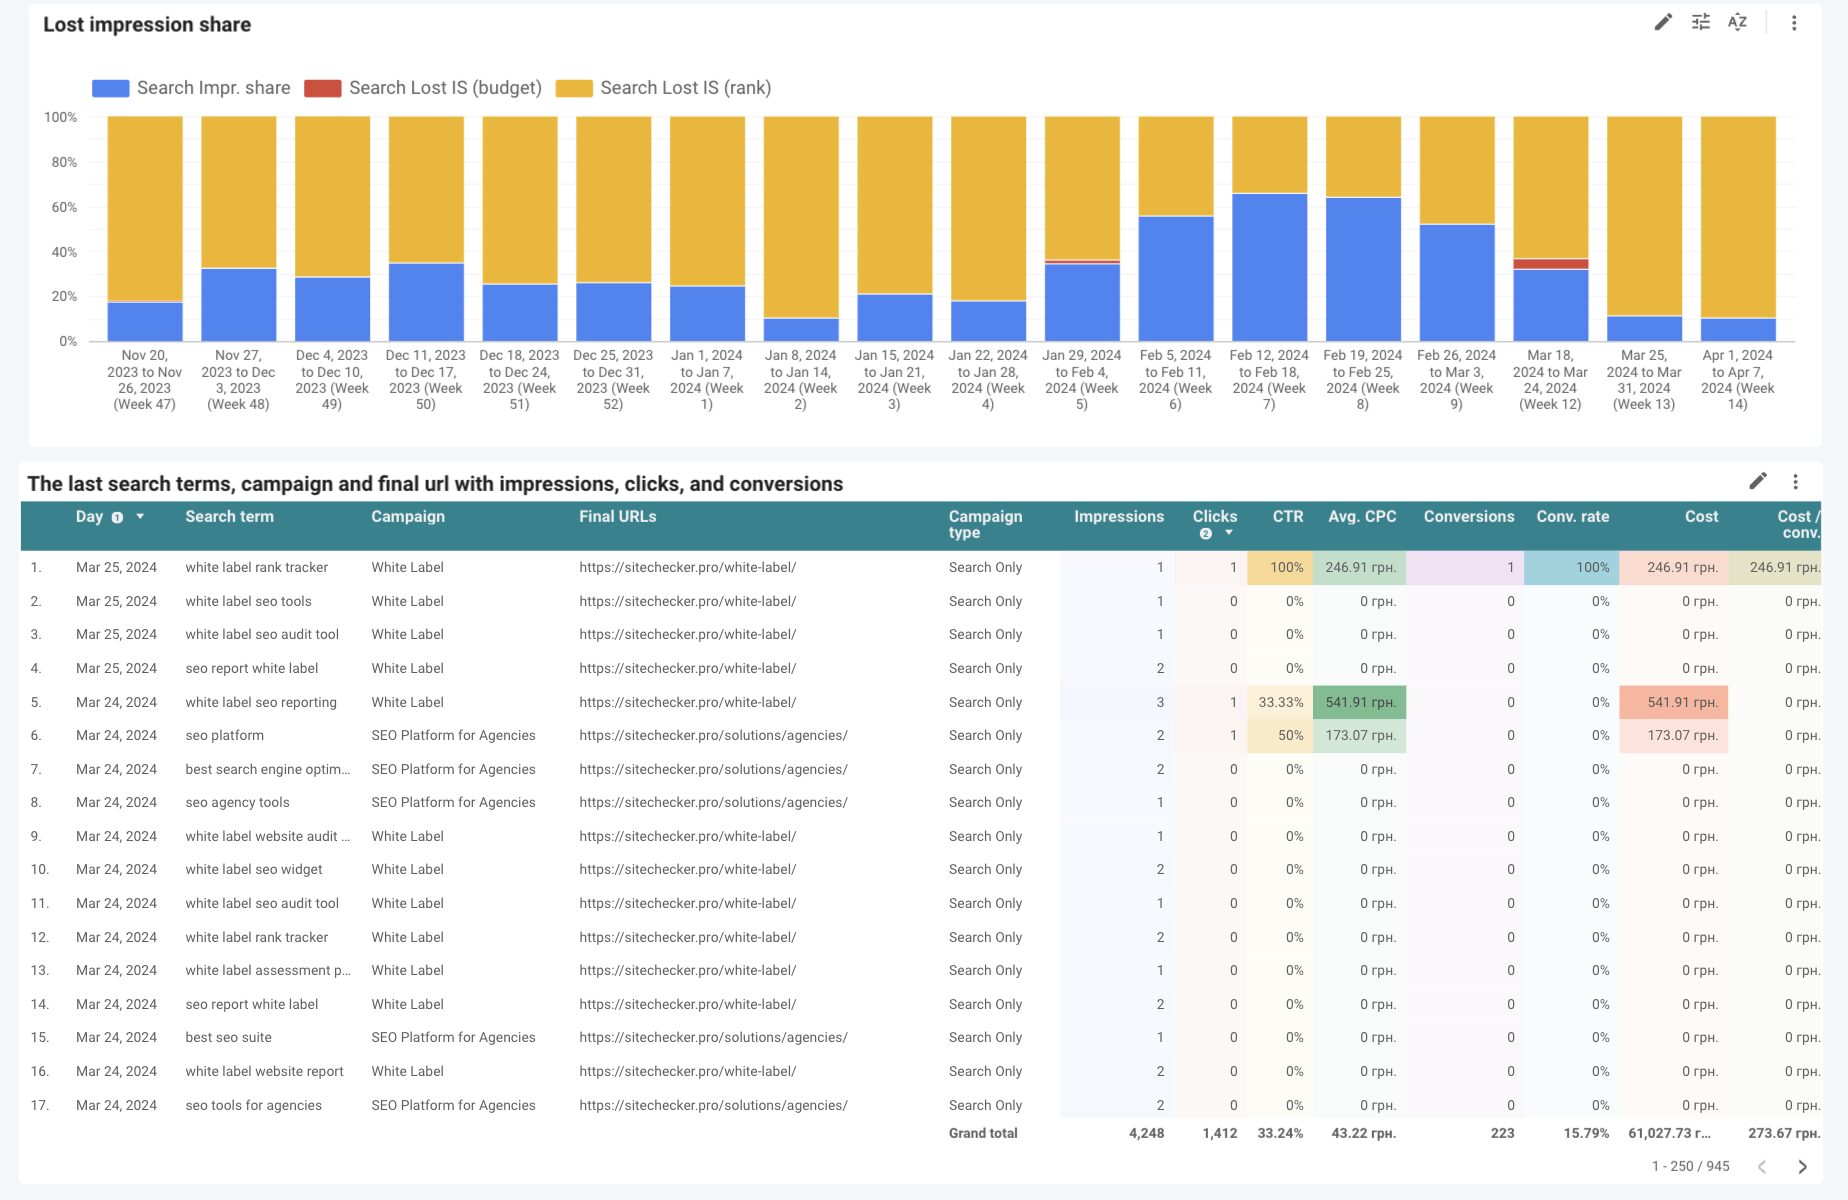
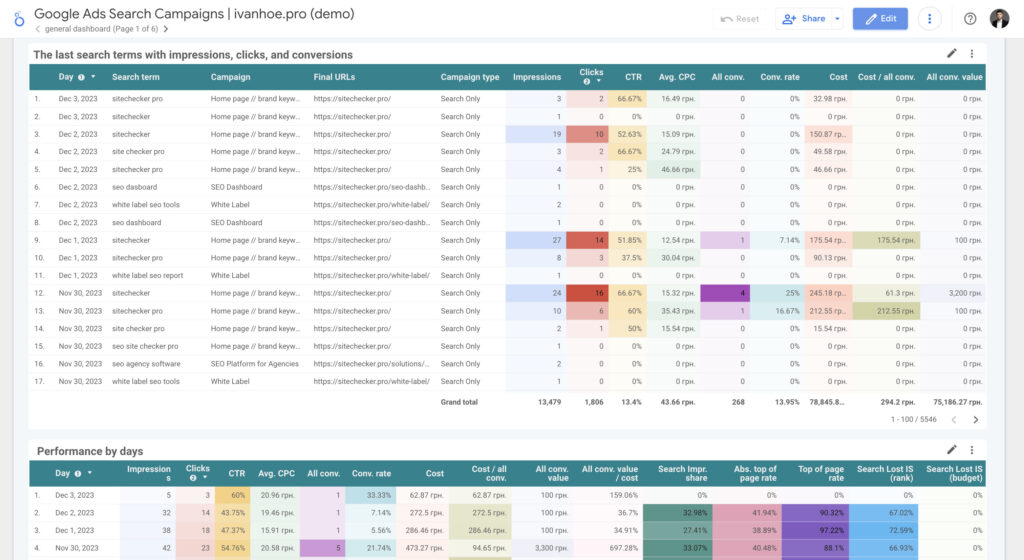
The third part contains the performance by keywords sorted by date from today and to the past, and overall performance by days, weeks and months.
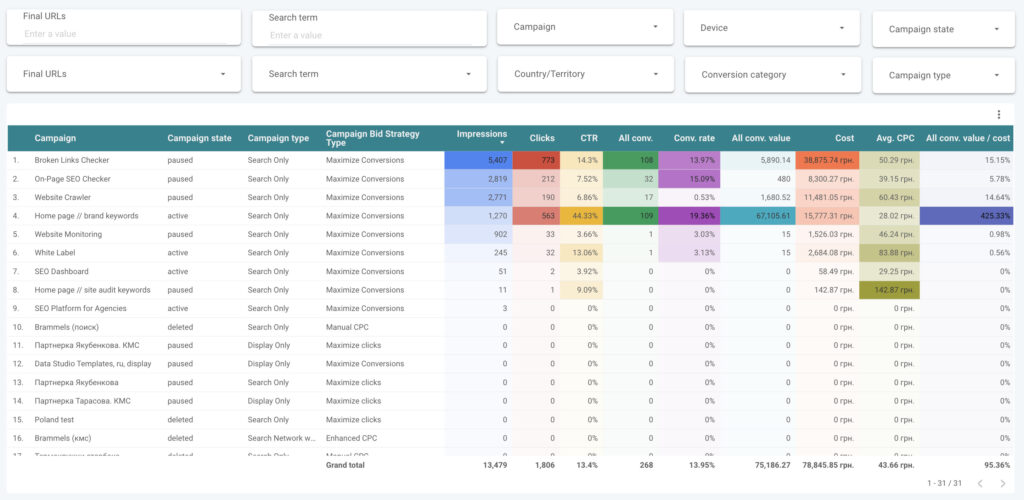
Campaign Insights
This page contains all the charts and filters related to campaigns. The first part contains a table with the overall performance of all campaigns.
The second part contains the dynamics of Impressions (or optional metric that you can choose in the chart) by Search campaigns by Weeks.
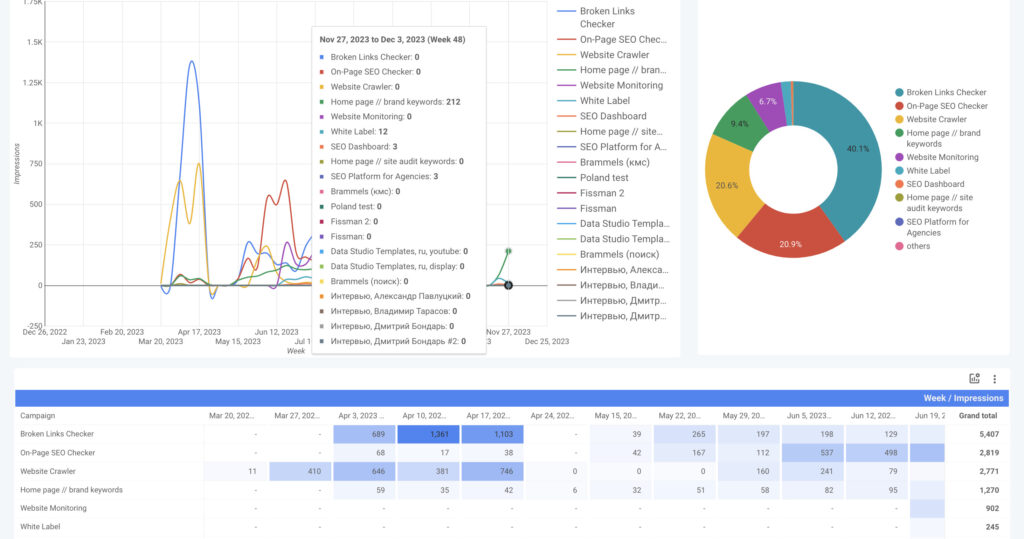
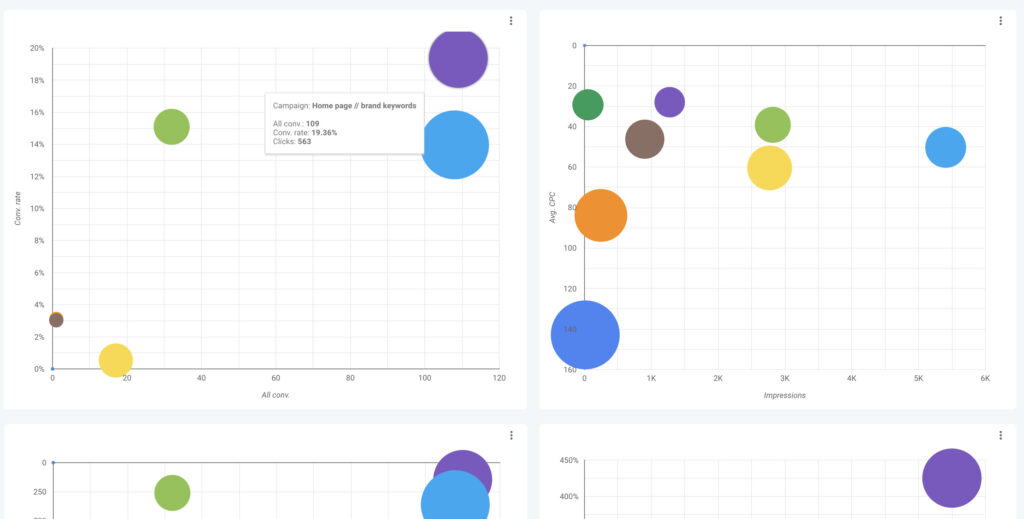
The third part contains scatter charts that help to identify the best-performing and the most promising campaigns.
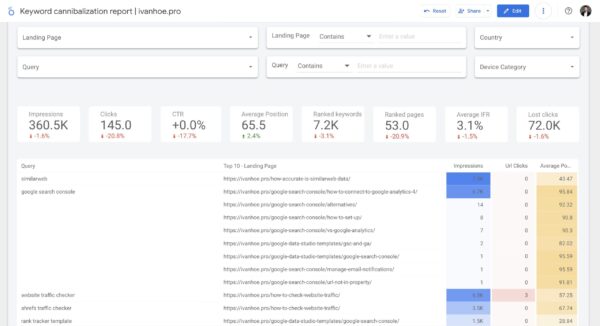
Search Keyword Insights
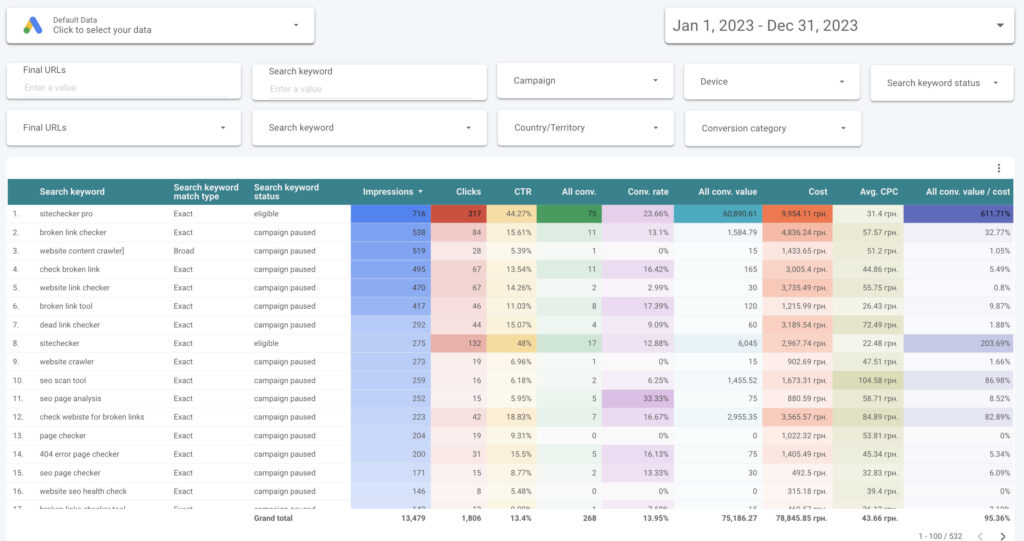
This page contains all the charts and filters related to the search keywords. The first part contains a table with the overall performance of all search keywords.
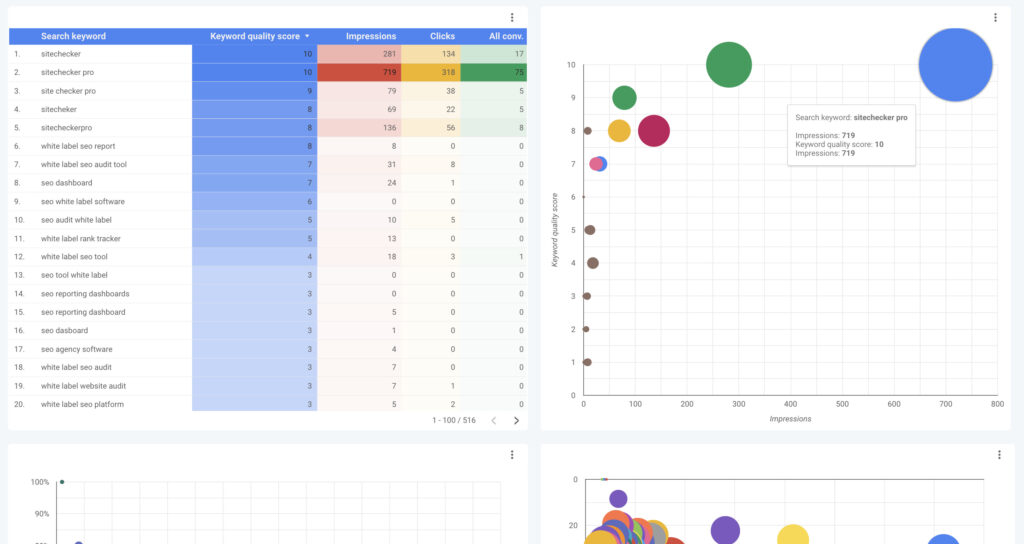
The Search Keyword Insights page has the same charts and tables as the second page (Campaign Insights), but it also has one important addition: a table and scatter chart for the Keyword quality score metric.
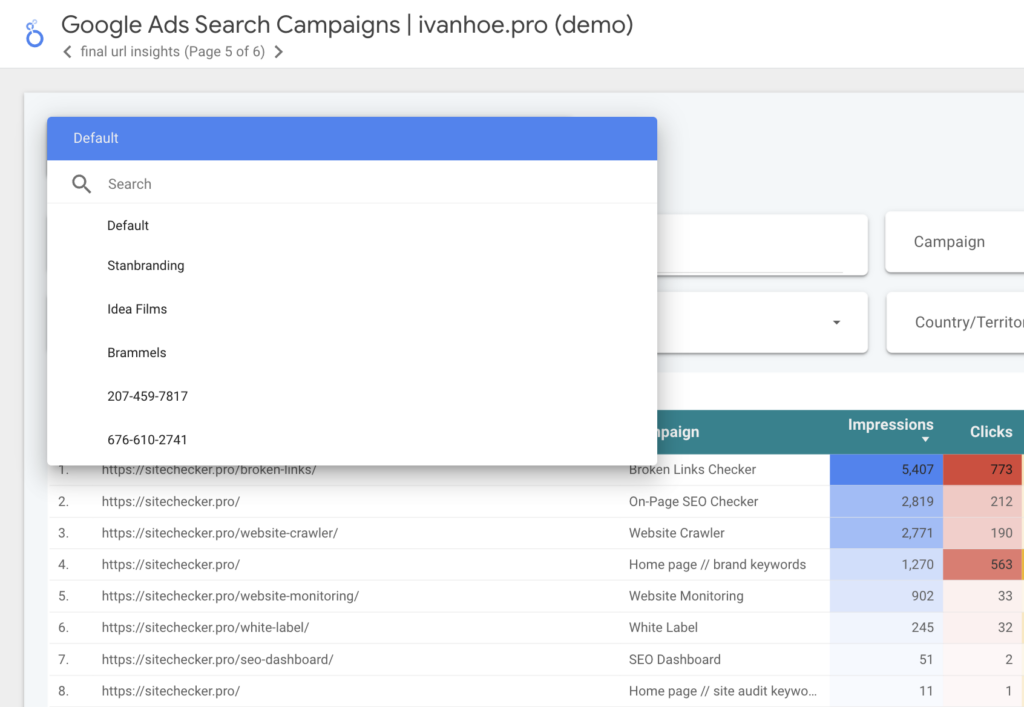
Search Term Insights, Final URL Insights, and Country Insights
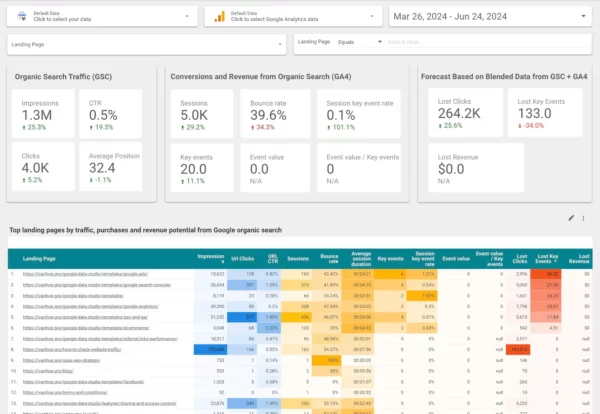
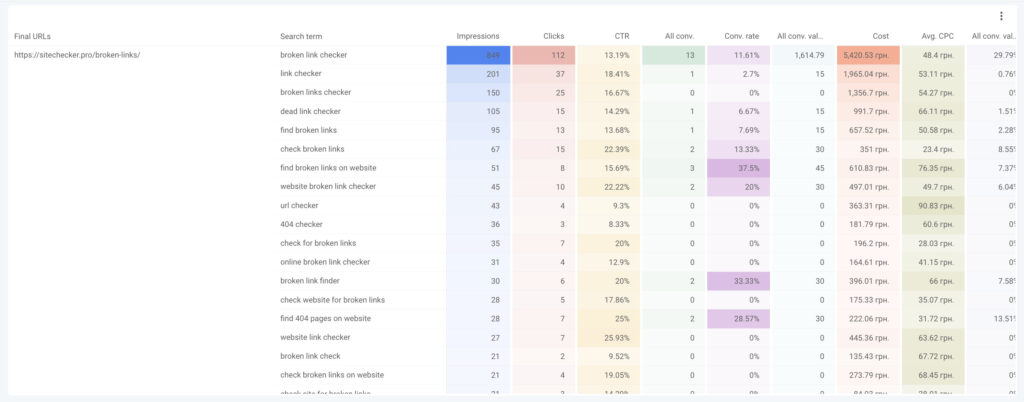
The last three pages have the same charts and tables as Campaigns Insights has but are applied to specific parameters (search term, final URL, or country). However, the Final URL Insights page also has a table where all search terms are grouped by final URLs.
How to work with Google Ads Looker Studio template
Basic
After buying the template you can work with it even with copying it. Just choose the Google Ads account which you need to analyze at a specific moment and all data and filters will be updated for a chosen Google Ads account.
Advanced
The advanced approach is copying the template and editing any part of it. For example, you may be interested in analyzing the dynamics of metrics not by weeks, but by days or months.

That’s it. You also can check Google Ads Looker Studio templates from other authors, that I like. If you have any questions write them to a chat or via LinkedIn or Twitter.
Additional information
| Data Sources | Google Ads |
|---|---|
| Custom Dimensions | No |
| Custom Metrics | No |
| Data Blending | No |