Google Analytics 4 Looker Studio Template
$199
This Looker Studio reporting template helps you visualize data with Google Analytics 4 in a convenient way to search for insights and create reports for your clients.
Description
Many GA4 users are dissatisfied with the user experience in the new interface as they cannot find many of the reports that were available in the old Universal Analytics property.
This template solves these problems and helps you quickly find answers to your questions.
Table of contents
- The purpose and the value of the template
- How the template works
- How to get started with the template
The purpose and value of the template
The template was created for data visualization of new Google Analytics 4 data, not Universal Analytics data.
If you do not know what a particular metric or parameter in a report means, use this checklist from Google.
The aim of the template is to get answers faster to questions that cannot be answered in Google Analytics 4, or it takes too long to get answers.
At the same time, the template does not replace the Google Analytics 4 interface itself, but only supplements it, since Google Analytics 4 has reports and functions that cannot be applied in Looker Studio: for example, a user journey map, multichannel conversions, cohort analysis, segment comparison, and others.
The question may arise here.
Why create another report if the Looker Studio template library is already full of reports on this topic?
There are many templates, but they do not suit me, each one is missing something. Somewhere little data is shown in dynamics, somewhere the design is not very good. But you will carefully study the library, maybe you will like some of the templates more than mine.
How the Google Analytics 4 Looker Studio template works
All template pages contain a calendar, filters, and the ability to select Google Analytics 4 properties available on your Google account.
The Google Analytics calendar and connector work at the report level – the data specified in them on one page will be applied to all pages of the template.
All pages have a default data range for this year.
Otherwise, they are different.

1. Conversions
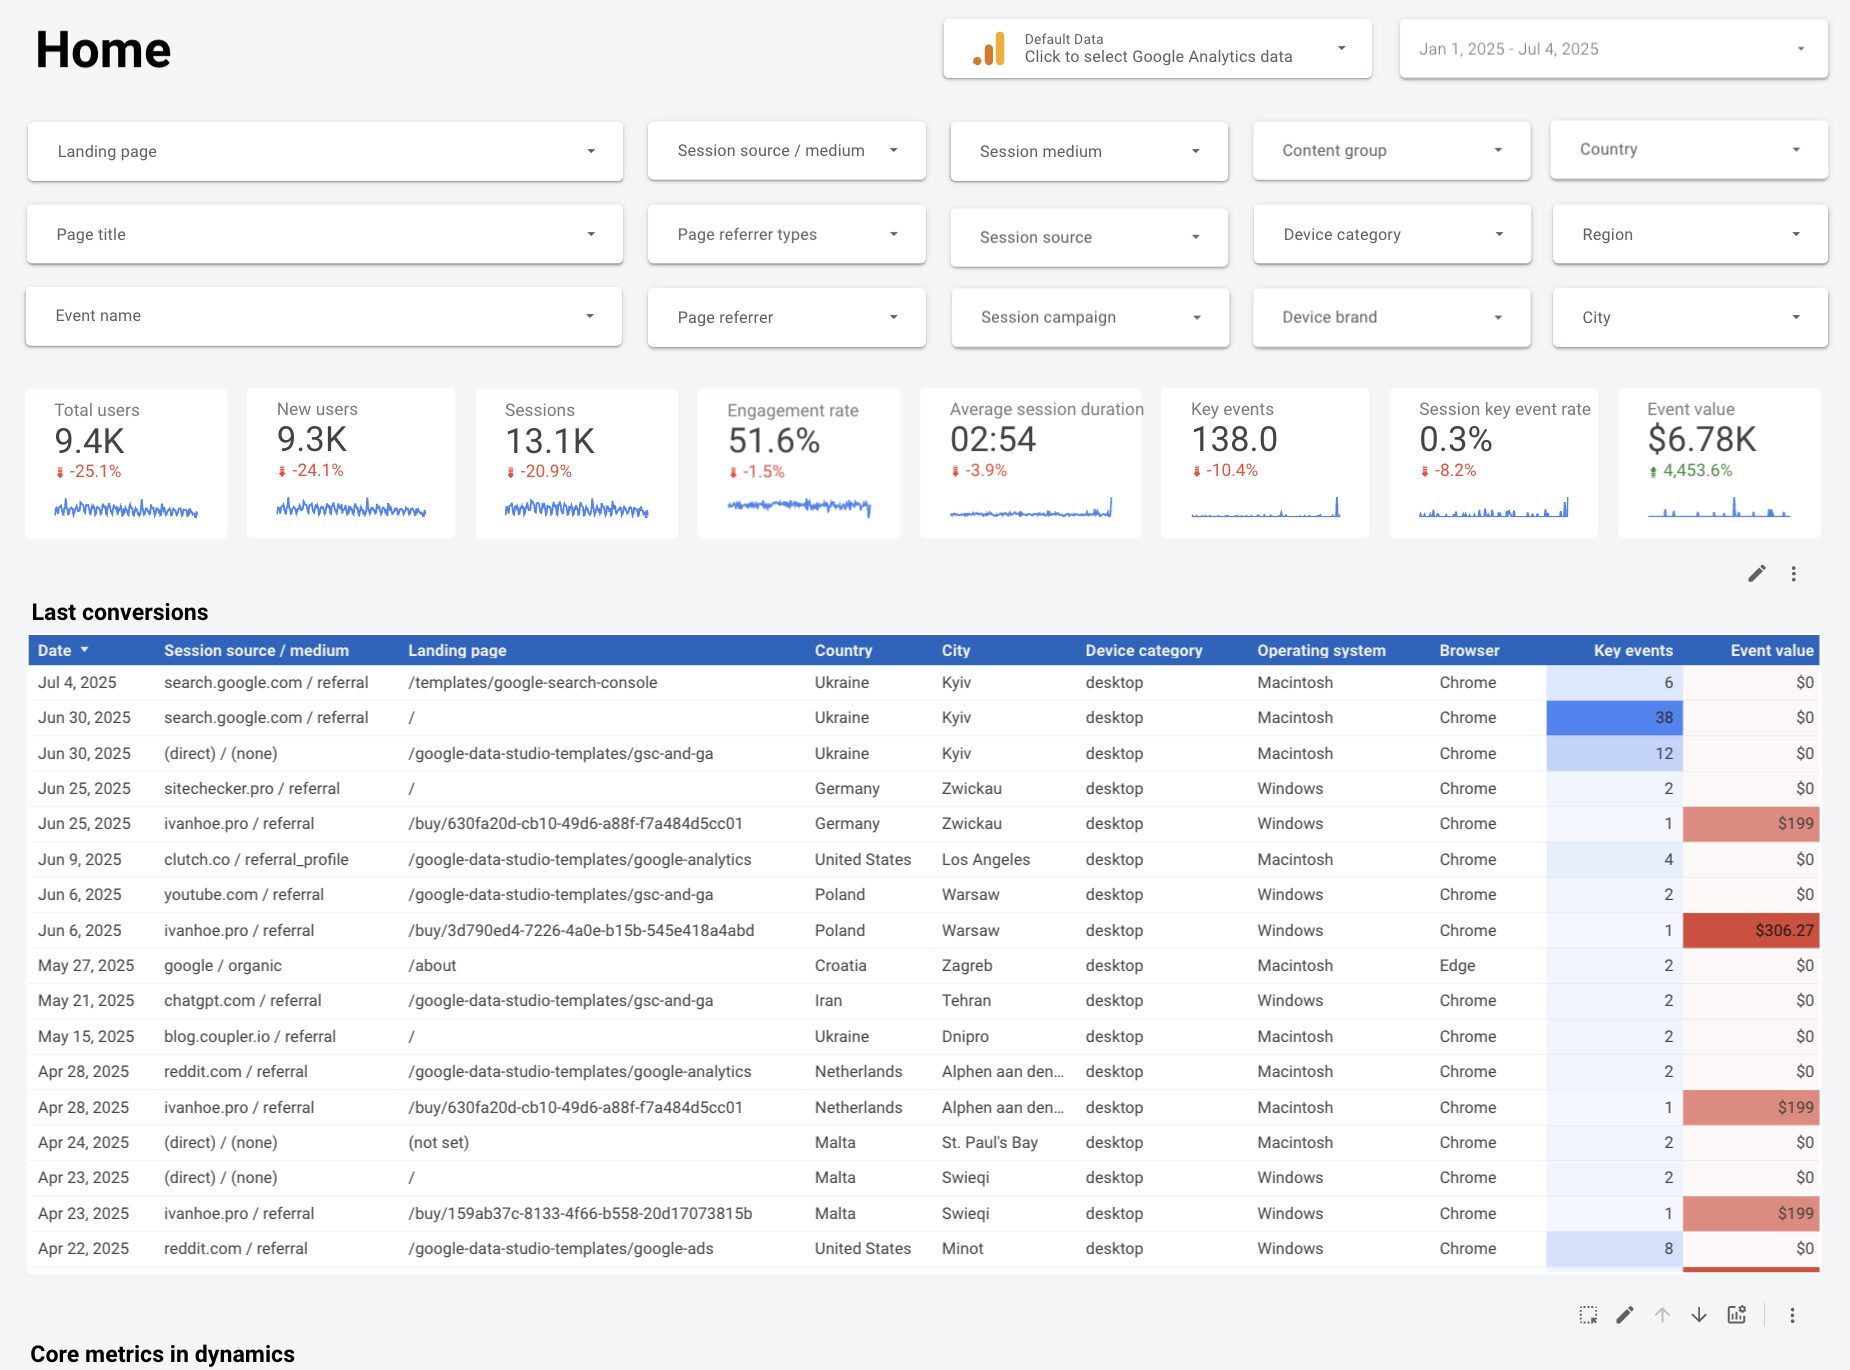
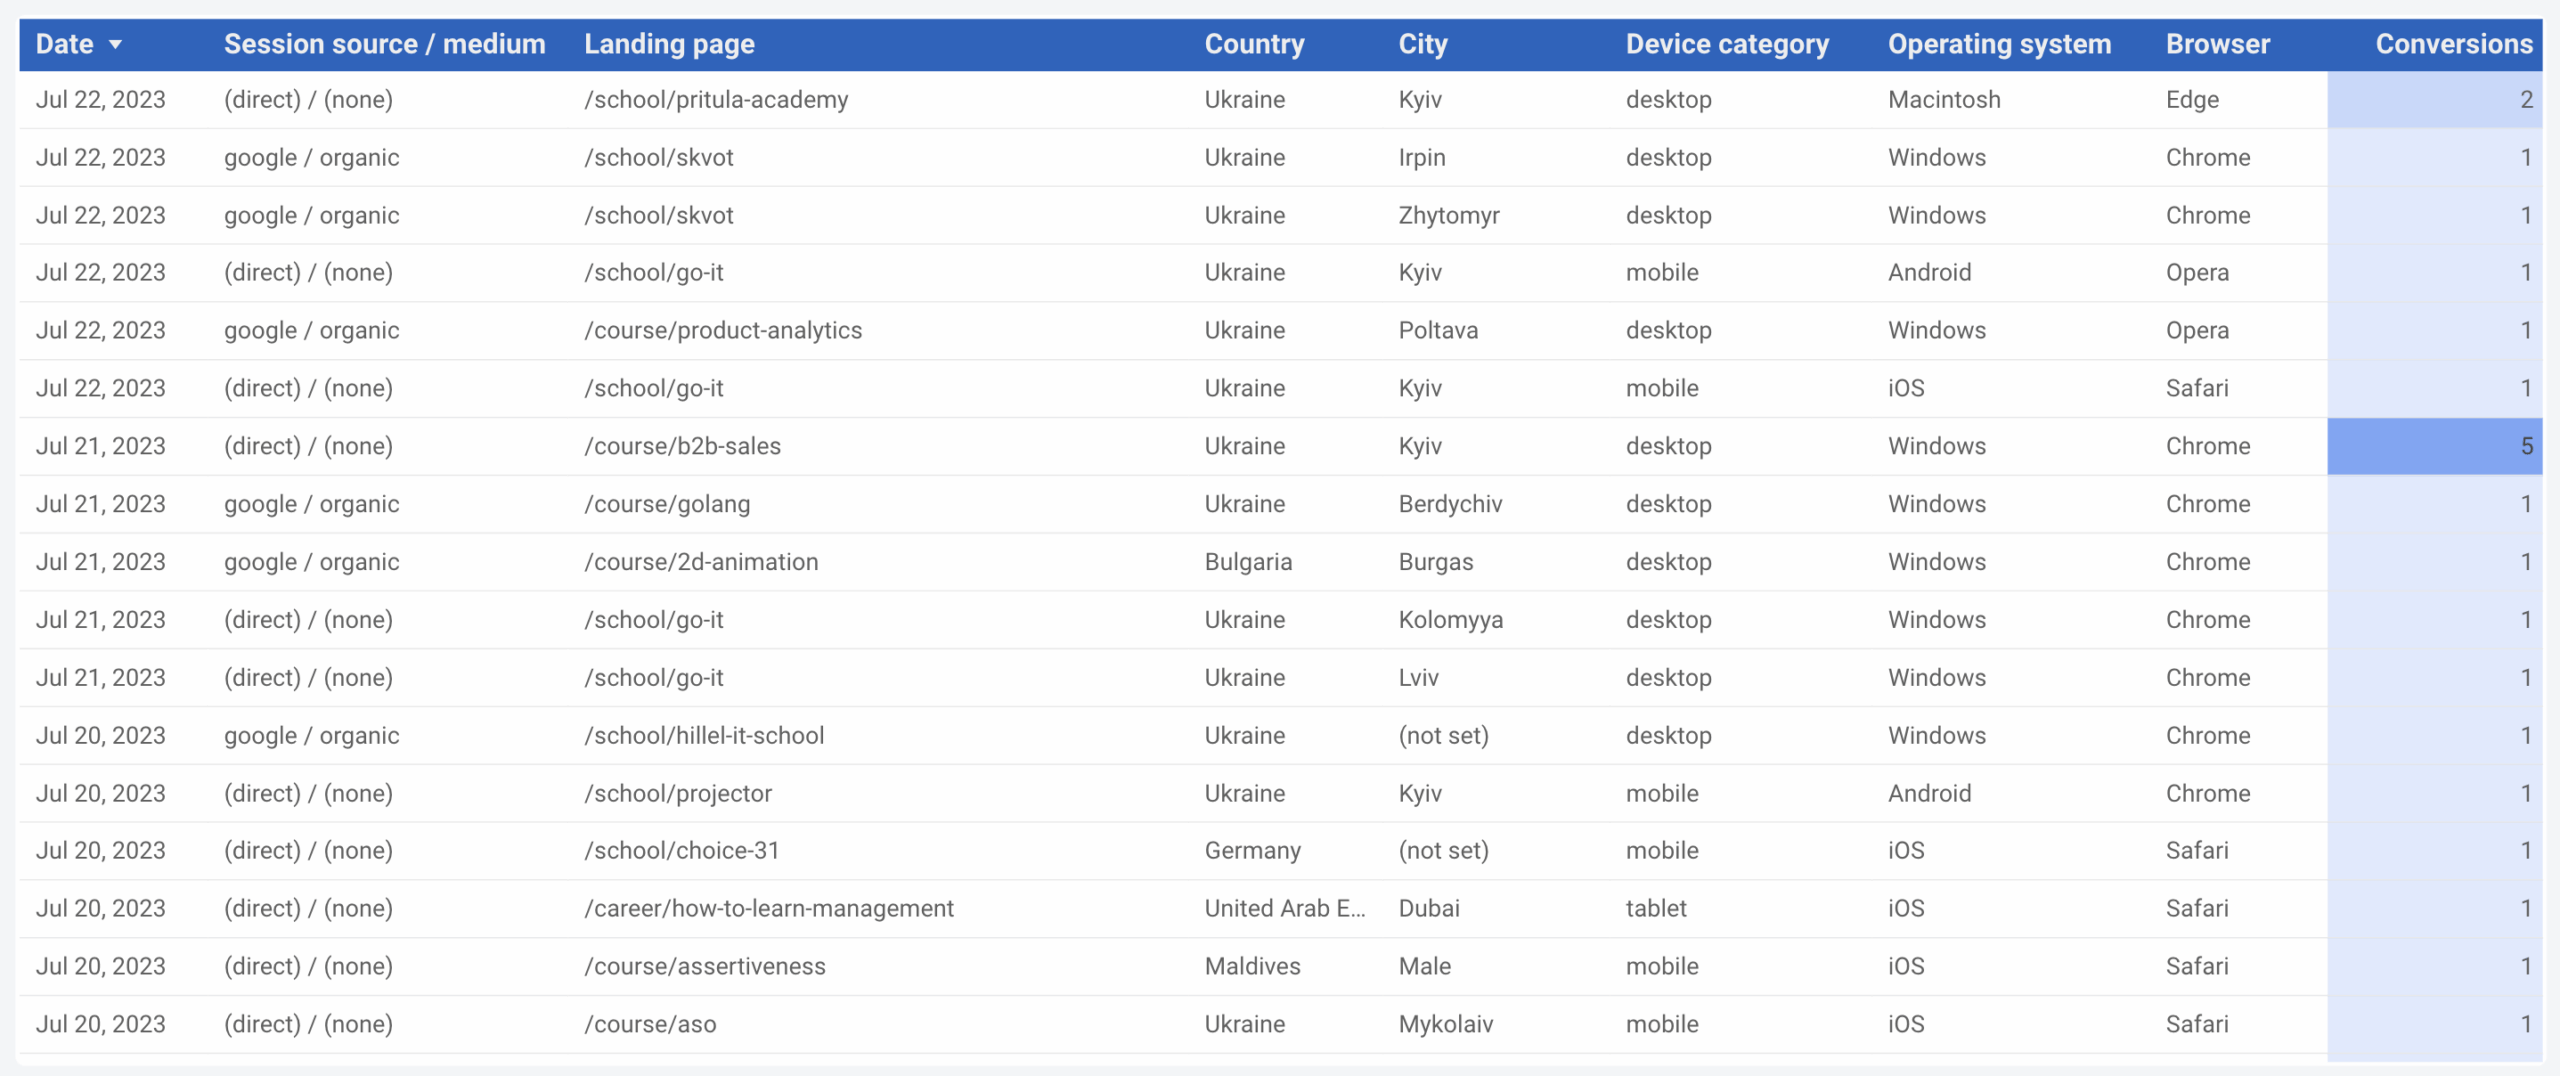
Consists of three thematic blocks. The first is a table with the characteristics of users who have recently reached the conversion. This is valuable for those who like frequently update their statistics or check how certain changes on the site were reflected in the conversion.

The second block is a summary of the main success metrics in tables and charts by dates, weeks, and months. You can also change the metrics you want to view on the charts.
This block makes it possible to look for trends in the fall or rise of key metrics from different heights of time.

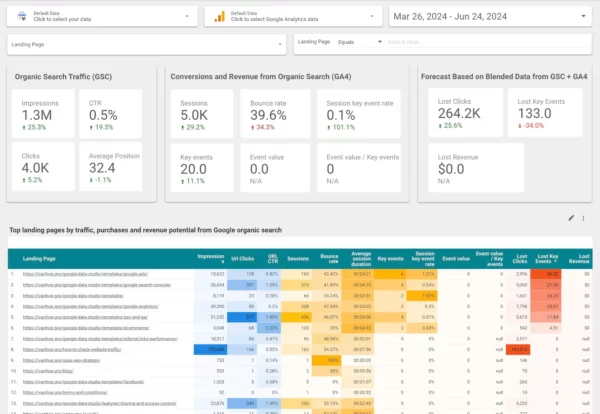
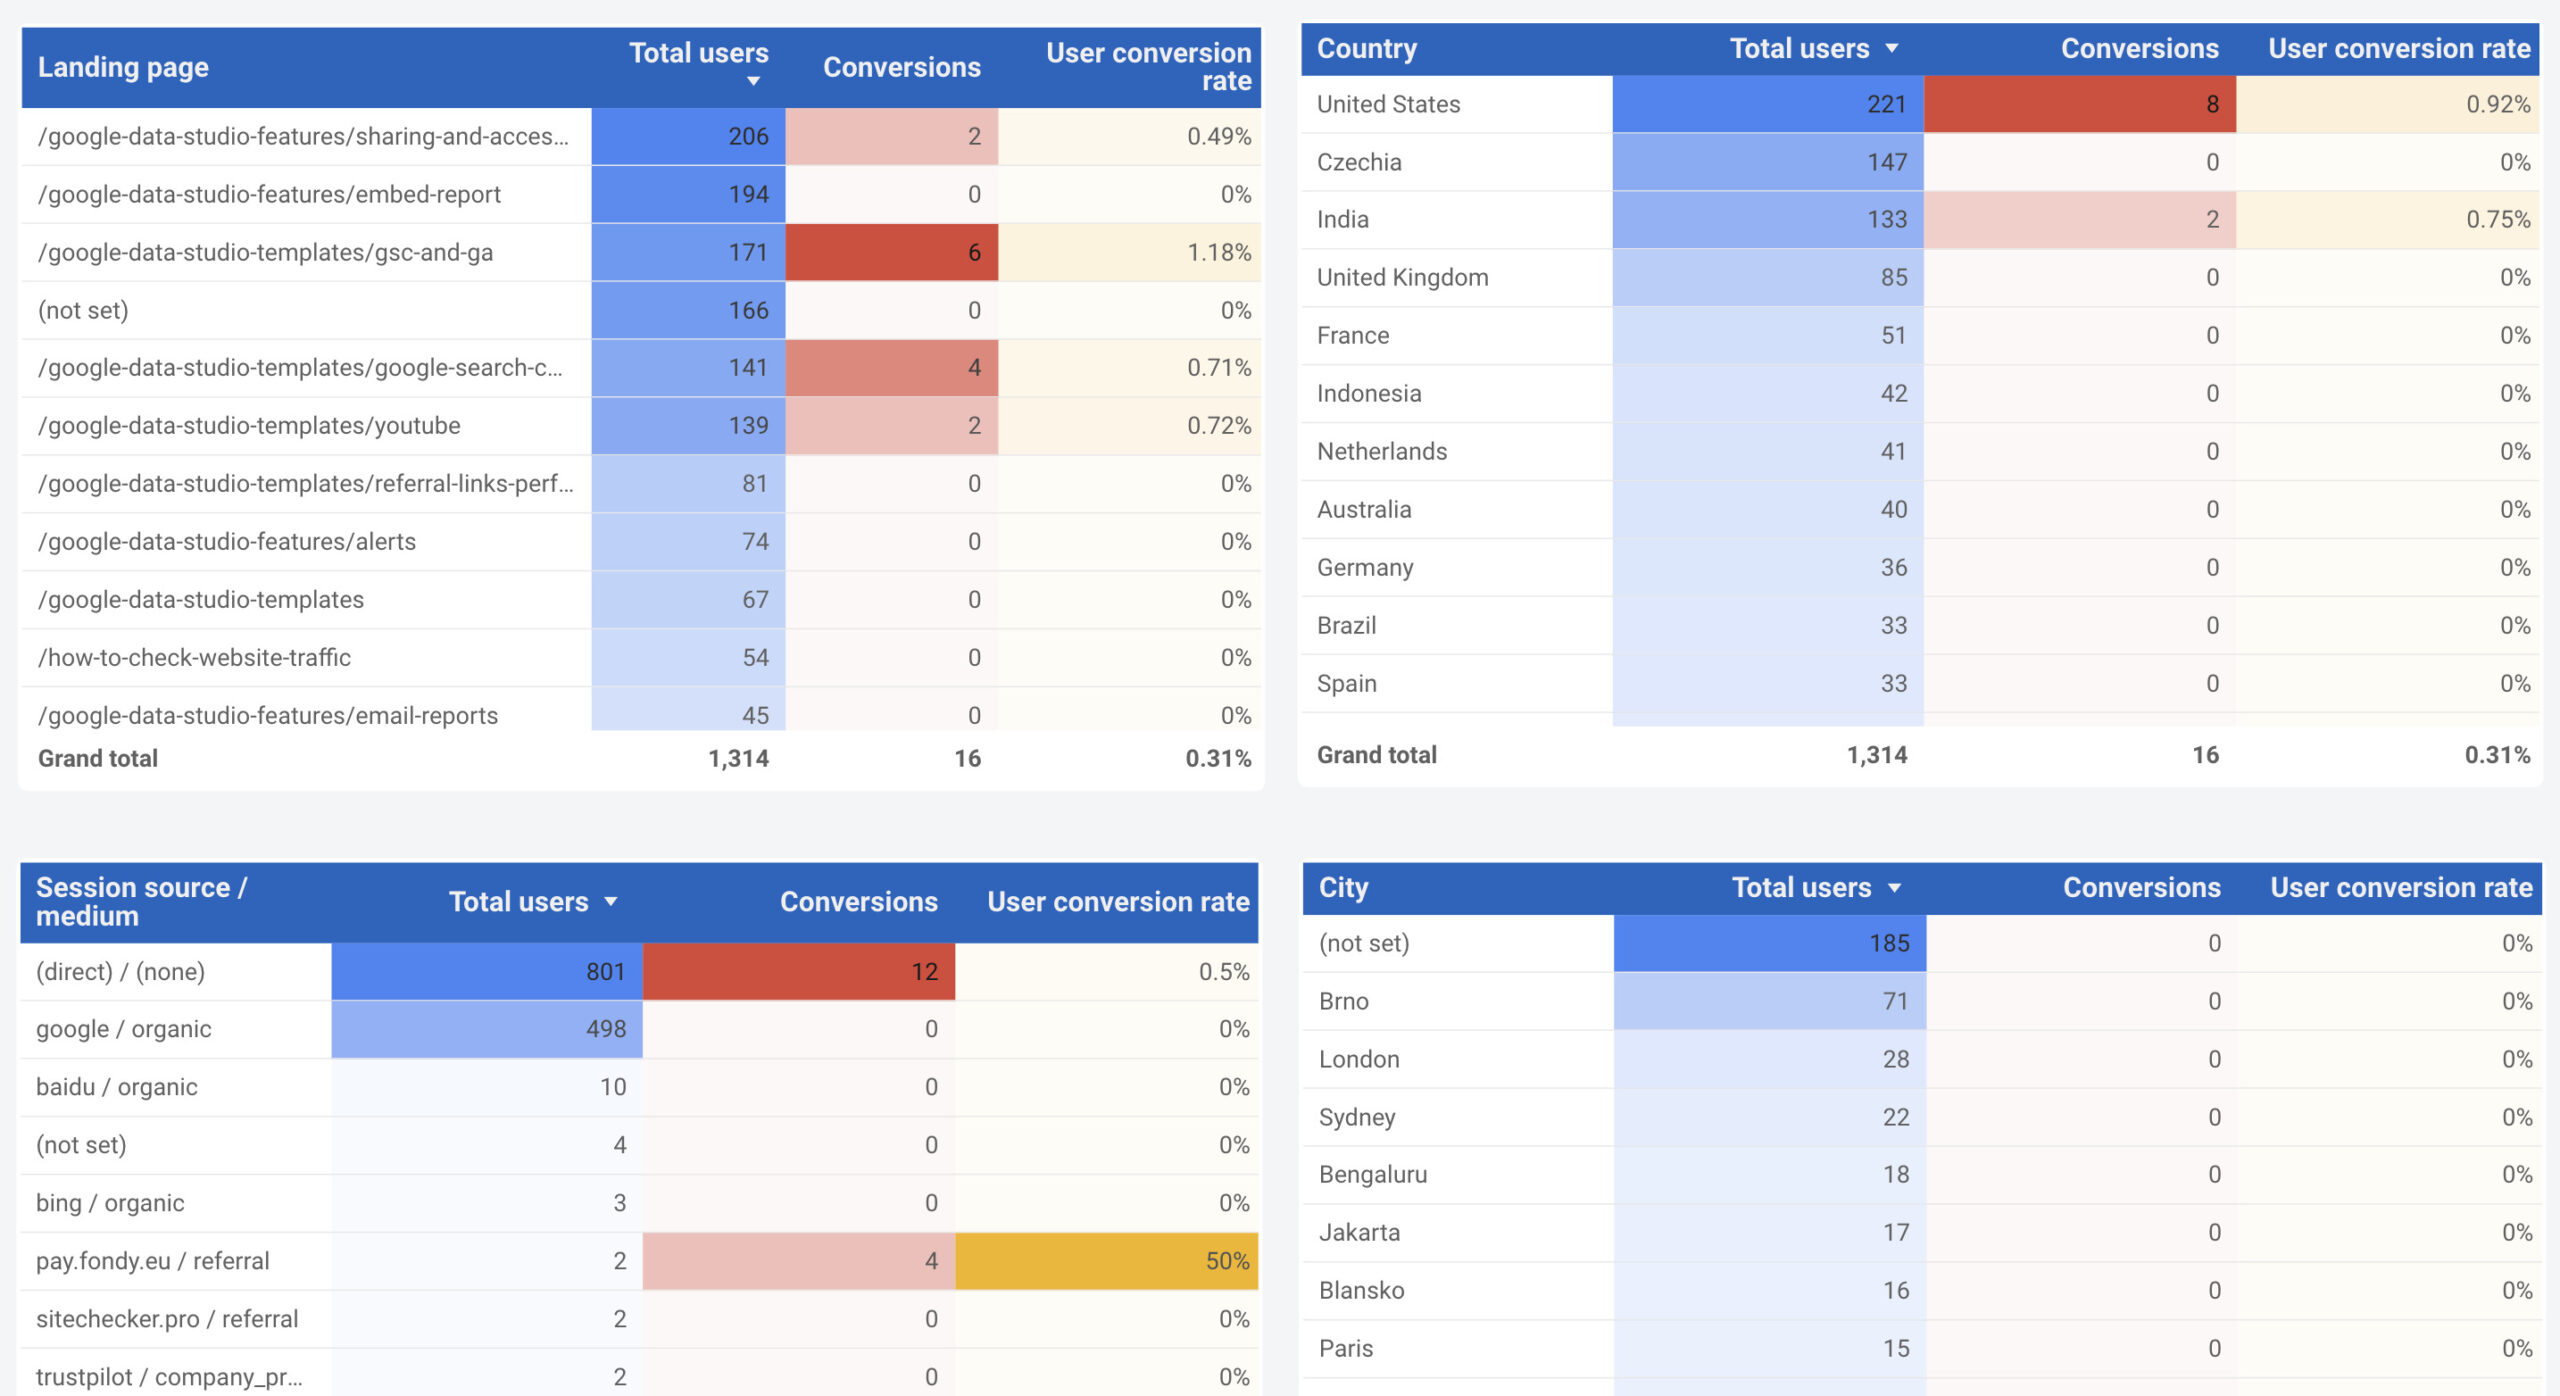
The third block is static tables with an assessment of the effectiveness of various types of parameters: which landing pages, countries, sources, devices, etc bring the most conversions.

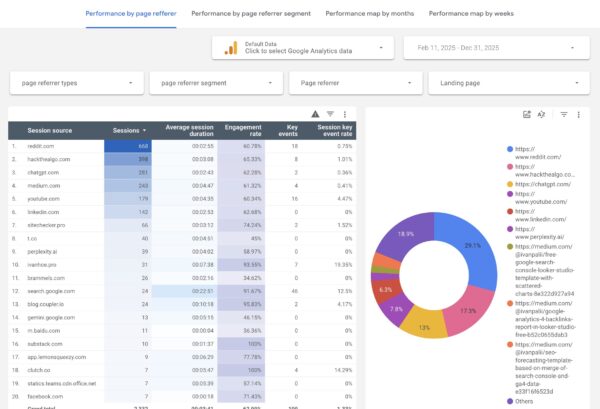
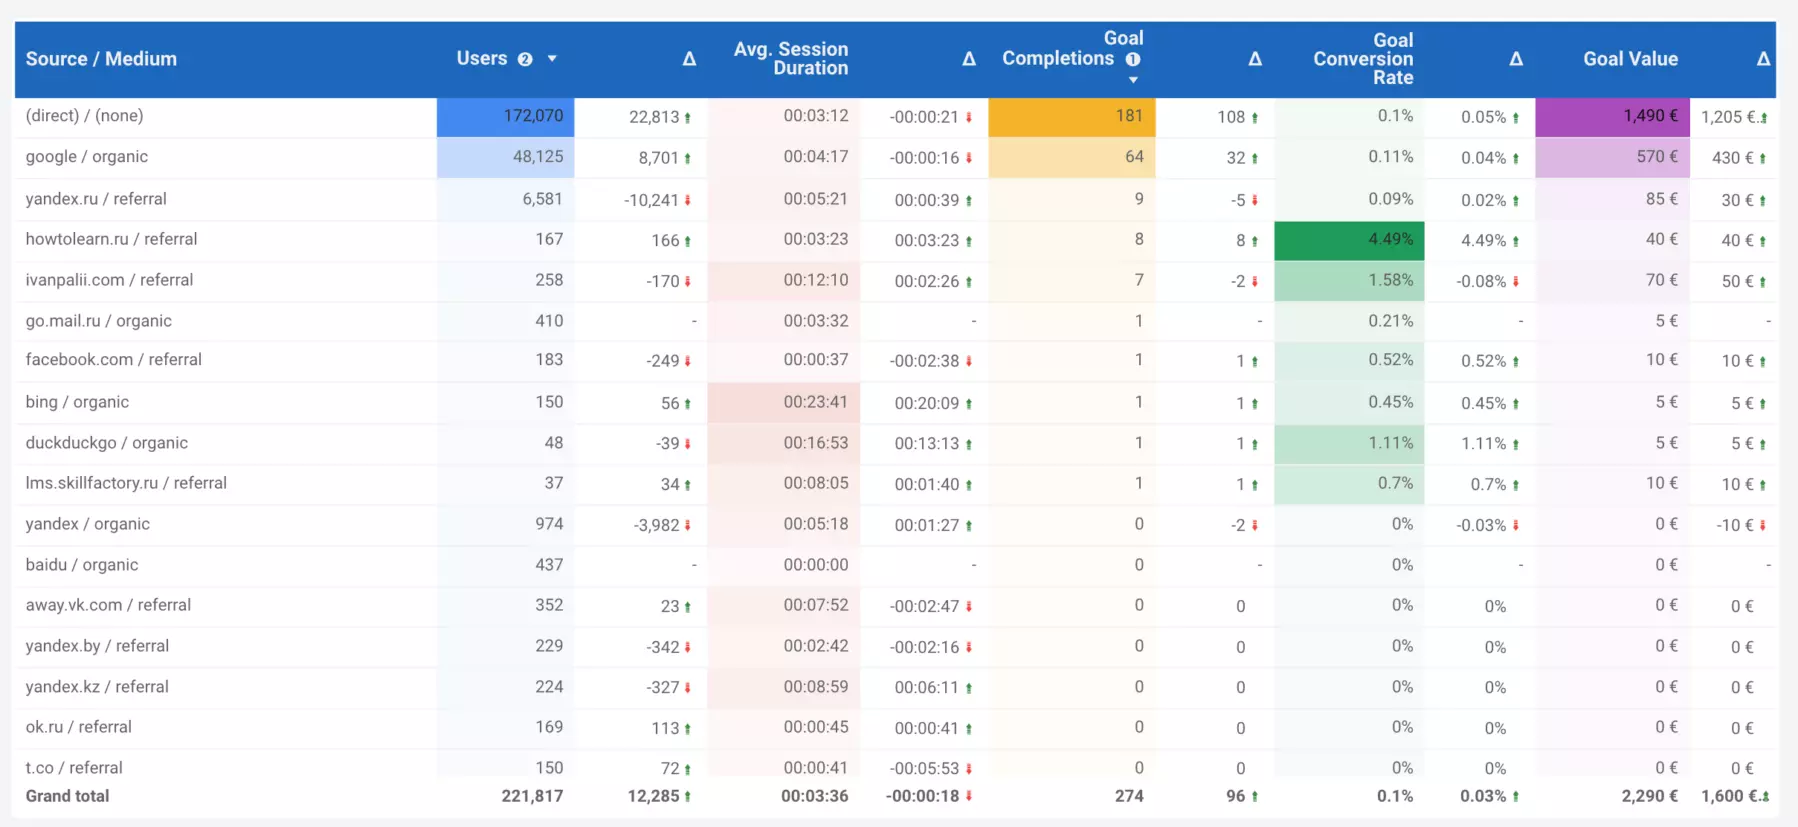
2. Acquisition
A table for assessing the effectiveness of traffic sources with delta changes in absolute numbers.
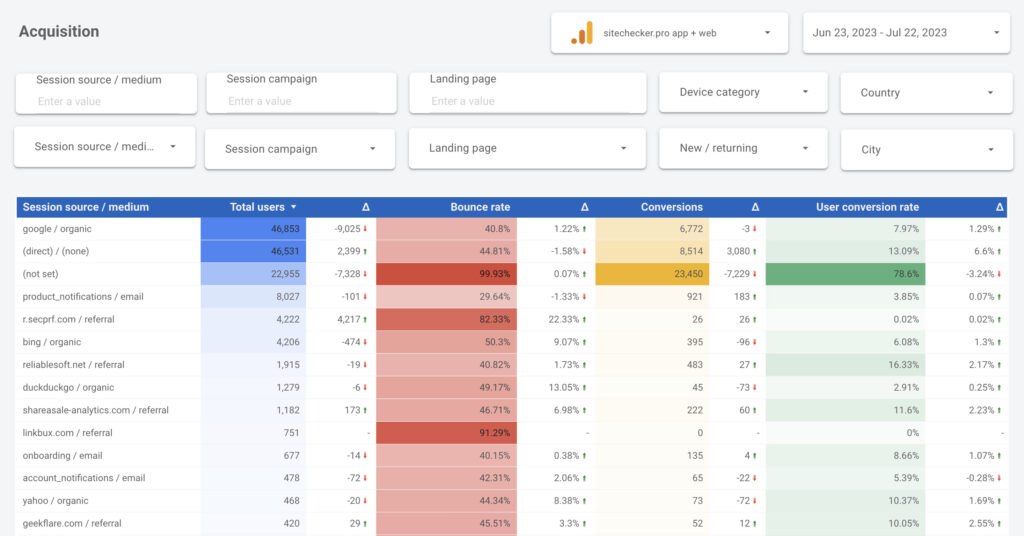
Unfortunately, in Looker Studio you cannot sort a table by delta. If this function is important to you, then export the table in Google Sheets and sort it already there.
Next are the graphs and the corresponding pivot tables:
- User dynamics by the most popular traffic sources;
- Dynamics of achieving goals for the most effective traffic sources by goals.
You can also change which data to display on the chart, but the sorting of parameters will remain the same. For example, in the graph below, you can choose to view the dynamics of users by the most effective sources to achieve goals.

If you want to evaluate the effectiveness of traffic only from referral links, it is better to use Google Analytics 4 backlinks report for this task.
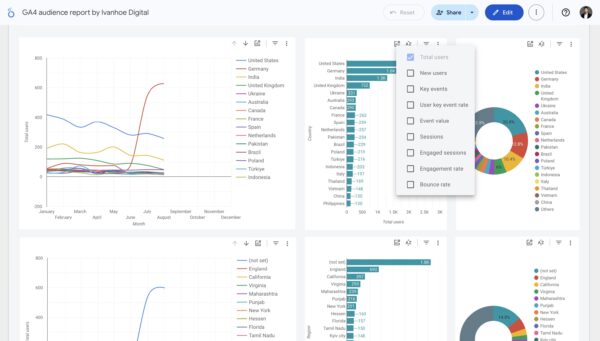
3. Audience
Here, the entire page consists of three types of graphs for each audience parameter:
- dynamics of users by month;
- the number of users in absolute terms;
- share distribution of users.
On the first and second chart views, you can also change metrics in two clicks.

4. Behavior (landing pages)
A table for evaluating the effectiveness of landing pages with delta changes in absolute terms. If you have dashes in the delta, it means that there is no data on the page for the past period: either there were no views on the page, or it did not exist at all at that time.
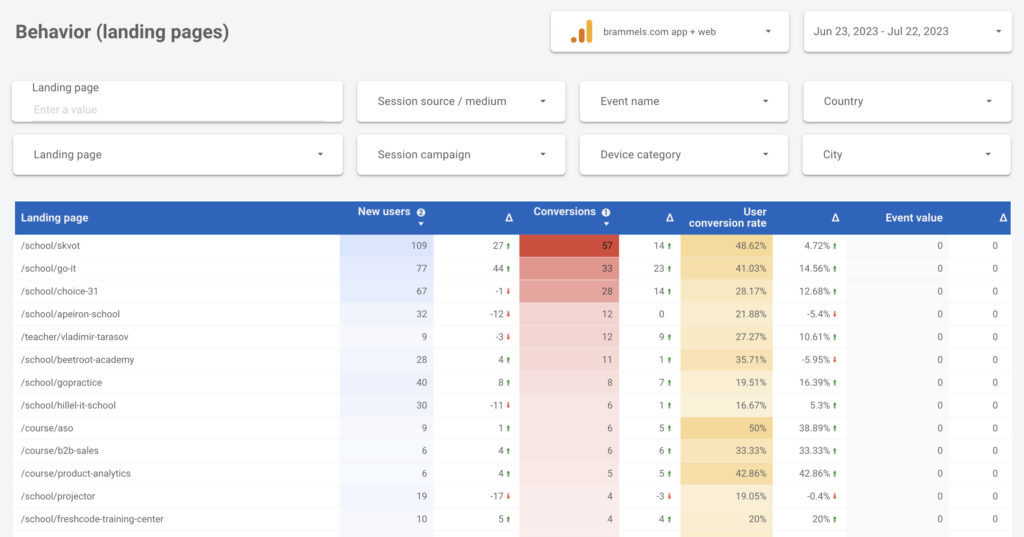
Grouping traffic sources by the most popular pages by conversion.

All other charts and pivot tables on the page are arranged in the same way as on the Acquisition page.
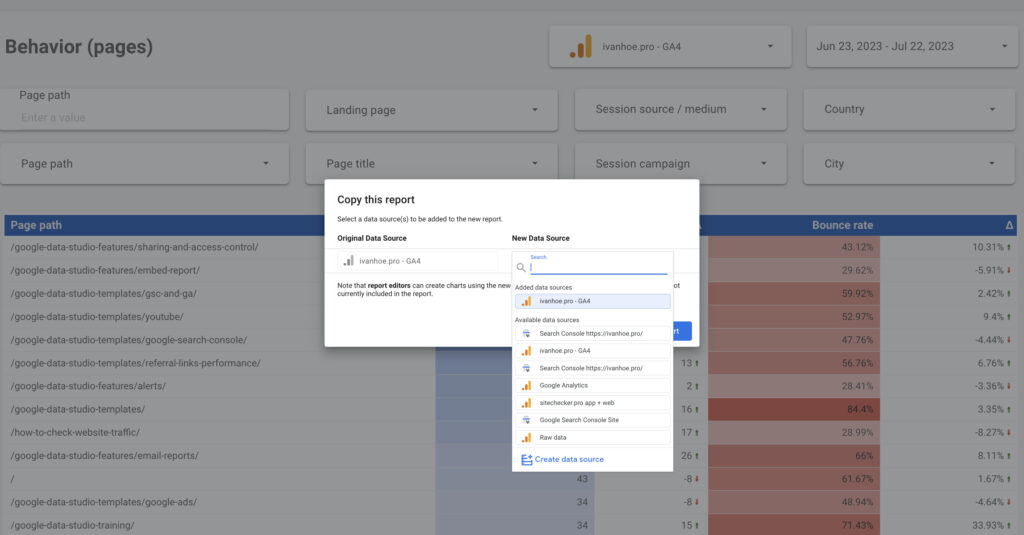
5. Behavior (pages)
If the main traffic to your site comes from search and users do not look more than 1-2 pages, then this report will largely coincide with the data of the Landing pages report. But for blogs, media, and forums, where there is a large amount of direct traffic and the number of pages viewed per session, the data can be very different.
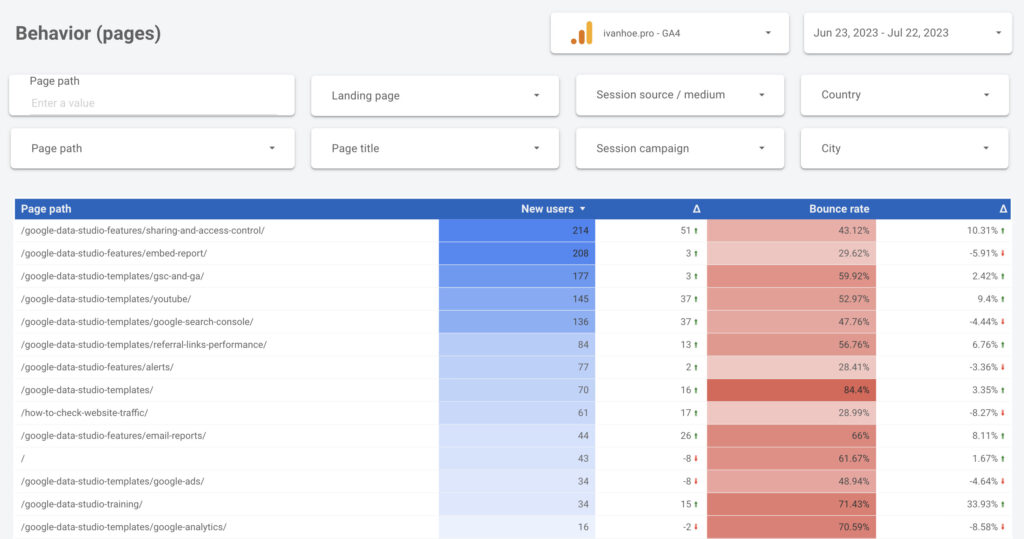
The important thing is that Pages has no conversion, only audience engagement metrics.
How to get started with a Google Analytics 4 report
You have three paths.
1. Save the link and work without copying
Since every page has a Google Analytics 4 connector, you can simply open my report and select your resource to see the data.
This is not the best option, since data loading will take more time.
But here’s the plus – any updates that I make to the template, you will immediately see them and be able to work with them.
2. Copy it for your site and do not change anything
Copying the template is as simple as possible here.
When you’ll click Make a copy you should choose GA4 property that will be used as your default property in your copied report.
Further, you do not change anything in the report but simply use the functionality that is.
3. Copy it for your site and customize it for yourself
You copy the report in the same way as in the previous step, but after copying, you change some settings for yourself.
What you most likely want to change:
- the default date range on the calendar that applies to all charts;
- deltas change from absolute to relative;
- remove/add some parameters or metrics to existing charts and tables.
This template is still extensible, especially for e-commerce metrics.
That’s it. You also can check GA4 Looker Studio templates from other authors, that I like.
Additional information
| Data Sources | Google Analytics 4 |
|---|---|
| Custom Dimensions | No |
| Custom Metrics | No |
| Conversions | Key Events |
| Data Blending | No |