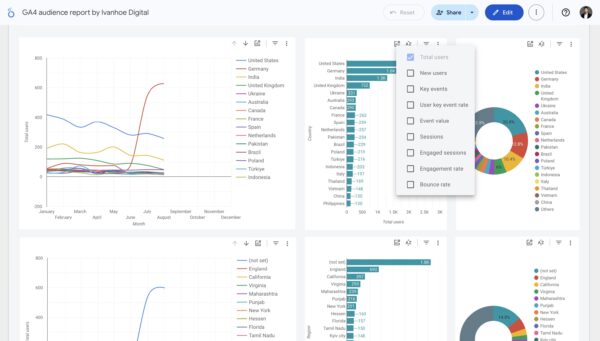
Google Search Console Looker Studio Template
$199
This Search Console Looker Studio template saves a lot of time during everyday work. 3 elements make this template unique: better filtering, rank tracker charts with daily keyword ranking data, and custom metrics you won’t find in GSC.
Description
Table of contents
- Why is the Google Search Console interface not enough
- How can the Looker Studio template help
- How custom metrics are calculated
- Structure of the template
- How to work with the template
- How to combine with rank tracker tools
Why is the Google Search Console interface not enough?
You also can use my video tutorial to find out how the template is built and how to use it properly.
If you visit the Google Search Console once a week/month and spend no more than 5-10 minutes there, you may not notice this problem. If you work with it more often, you will spend a lot of time switching filters.
The Google Search Console interface is good:
- to quickly and roughly assess the status of sites in Google Search;
- for a one-time audit of promotion dynamics (in the console it is convenient to compare data for different periods, by different countries/pages/keywords/devices).
The Google Search Console’s interface is weak:
- for regular analysis of the effectiveness of promoting a particular category, language version, page.
In the GSC, you need to constantly fill filters, and you can’t save them. Each new session of working with the tool and analysis of the same pages takes the same time, although it could take much less.
Here are examples of questions for which you find it difficult to get answers in Search Console:
- how many unique keywords does my site and specific pages rank for, and how does that number change over time?
- how many more clicks can my site get for all the keywords it ranks for if it ranks in the top 1 for all those keywords?
- how have the positions for the top 10 keywords on a particular page changed over time?
Also, the table with the data is static, and it is difficult to track the dynamics of search engine rankings at once all the keywords on the page.
How can the Looker Studio template help?
The goal of the template follows just from the problems of the Google Search Console interface – to spend less time on regular analysis of the effectiveness of site promotion, category, page.
After a one-time setup, you practically do not need a keyboard to fill the filters – just a mouse/touchpad.
1. You can work with the report without any editing
Log in to the report when you’re logged in to your Google Account, and the filter automatically pulls up the list of sites you have access to in the Google Search Console. Now you don’t have to copy the report at all to start using it.

2. Flexible page and keyword filters
Two types of filters by pages and keywords greatly speed up the work with data.

The first kind of filter is select. In it, you can select any number of pages and keywords, without becoming attached to their content.
The second type of filter is the search. In it, you can filter pages and keywords by any occurrence.
3. Easy-to-use search engine keyword rankings report based on average position data

4. Calculated metrics
These are metrics that are not by default inside the Google Search Console. We calculate them ourselves based on default metrics and some assumptions.
How custom metrics are calculated?
Ranked keywords
1. Formula
[dt_code]COUNT_DISTINCT(Query)[/dt_code]
2. Value
It makes it possible to see the number of ranked key phrases within a specific page, category, word occurrence.
Ranked pages
1. Formula
[dt_code]COUNT_DISTINCT(Landing Page)[/dt_code]
2. Value
It makes it possible to see the number of ranked pages within the site, category, keyword.
Potential rank
1. Formula
[dt_code]Impressions / Average Position[/dt_code]
2. Value
It helps determine which keywords to work on first. The key value is that it helps to determine the keyword’s profitability based on two critical parameters: the size of the gain (number of impressions per word) and your proximity to this benefit (your position).
Average Ideal Final Result (Average IFR)
1. Formula
[dt_code](Impressions / Average Position) / Impressions[/dt_code]
2. Value
It shows how much you have reached the ideal final result within the keyword, page, category, and site, but only based on those queries for which you are already ranking.
Lost clicks
1. Formula
[dt_code](Impressions * 0.2) – Url Clicks[/dt_code]
2. Value
It shows how many clicks you lose on a keyword, page, or site, while not standing at the top-1. It is clear that each search query has its own CTR and it can vary greatly. But I specifically took the lowered CTR of the first position so as not to overdo it.
A study by Backlinko and other sources shows similar data – that the first place receives about 30% of clicks. But since a huge number of requests in search results are generally passed without going to sites and this figure is growing every year, it is better to average it to 20%.

Therefore, do not be surprised if for some queries you have a negative value in the Lost clicks metric. This will be especially true for brand requests. You can easily fix the default CTR of the first position in the formula, if necessary.
The structure of the Google Search Console Looker Studio template
The template consists of 8 pages.

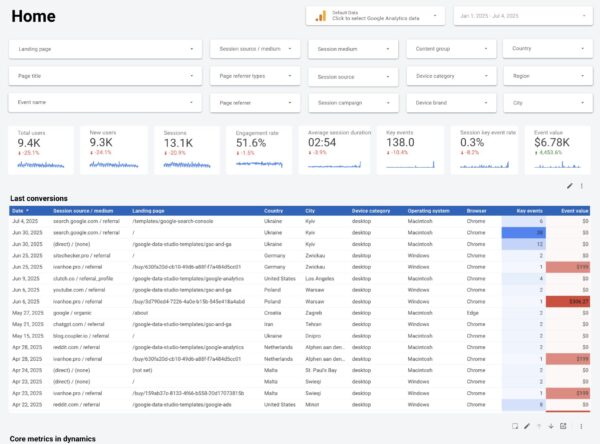
1. General dashboard
The scorecards and chart with dynamics by default Seach Console metrics and some custom metrics that I created based on default.

Easy to sort and export tables by landing pages and queries that help you to find out low-hanging fruits in ranked keywords.

2. Keyword rankings
One of the most valuable charts with Average Position dynamics by top keywords by Impressions. You can change the metric that is used for filtering top keywords for this chart after copying the template.

And pivot table with Impressions and Average Position for all keywords. And you can filter the table and chart by landing pages and queries.

3. Keywords grouped by pages
In Search Console, you always see two separate tables: Queries and Pages. You can’t overview quickly the list of landing pages and keywords they rank for. In my Search Console template, you can do that.

4. Landing pages rankings
The same chart and pivot table as for Queries on the 2nd page, but for Landing Pages.

5. Keywords delta with position
The list of tables with predefined periods (7 days, 30 days, 90 days, 180 days) and custom date range to compare search metrics by keywords including Average Position. On this page, you can’t filter keywords by landing page, only by Queries.

6. Keywords delta without position
Here is the same goal as on the previous page, but here you can filter keywords by Landing Pages, but can’t view the Average Position metric.

7. Landing pages delta
The list of tables with predefined periods (7 days, 30 days, 90 days, 180 days) and custom date range to compare search metrics by landing pages.

8. Country delta
The list of tables with predefined periods (7 days, 30 days, 90 days, 180 days) and custom date range to compare search metrics by countries.

How to work with this template?
Basic
You just save the report to your bookmarks and work with it when you need it. I do not plan to edit this version of the report, so you will work in a single interface all the time.
The second option – you copy the report as in the screenshot below. The first dataset is the Site Impression, and the second dataset is URL Impression. After copying it will appear on the page of your files in Looker Studio. This option is much better.

Advanced
In the advanced version, you copy the report and edit it for yourself. There is a high probability that you will want to fix the following.
- Remove or replace my calculated metrics.
- Remove or replace any graphics.
- Set the sorting of values in filters not by impressions, but by clicks.
- To expand the limits of data display in graphs, tables.
How to schedule the automatic delivery of this report every month?
Click schedule delivery and set options for which content, in which period, and to whom to send.

Note that you can set up to include in the email only specific pages from the report, not all pages.

And also can apply filters that the report contains to send data only by specific country or landing pages or even queries. You can apply different filters for different pages.

How to combine this template with rank tracker tools?
In Sitechecker, we are developing a keyword rank tracker. And when communicating with users of this tool, I see that they often do not understand:
- why do they need data from both the Google Search Console and the rank tracker?
- how to use these tools together effectively?
The truth is that quite successfully the site can be promoted using data only from the Google Search Console. But it’s more difficult and longer.
Despite a large amount of valuable data in my report, it has many shortcomings, which arise from the fact that there is little data in the Google Search Console and the fact that customization in Looker Studio is very limited.
A list of what this report cannot do, but keyword rank tracker tools services can.
1. No more than 5000 keywords per day
If your site is ranked by more than 5000 keywords, you will not be able to watch the dynamics of the ranking of keywords beyond this maximum.
Yes, you can divide the site into categories by URL and look at the dynamics of individual categories, but this is not very convenient.

2. It is impossible to derive key number metrics in a range of positions: top-1, top-3, top-10, top-30, top-50, top-100
I searched and experimented for a long time how this can be done in Looker Studio, since, there is all the data for this.
This formula was supposed to solve the problem.
[dt_code] CASE WHEN Average Position = 1 THEN “Top 1” WHEN Average Position < 4 THEN “Top 3” WHEN Average Position < 11 THEN “Top 10” WHEN Average Position < 31 THEN “Top 30” WHEN Average Position < 51 THEN “Top 50” WHEN Average Position < 101 THEN “Top 100” ELSE “No positions” END [/dt_code]
But Looker Studio does not allow you to create parameters based on the conditions of the metric values or divide the metric into separate types. Maybe one of you will find how to do this.
3. You cannot receive notifications on triggers
In Looker Studio, you can configure the regular sending of a report by mail to yourself and your colleagues or clients. But this is simply uploading a report that you can access anytime.

The Google Search Console team is experimenting a bit with different valuable triggers. But while they are moving slowly in this direction.

Position monitoring services, on average, send more valuable reports.
4. You can’t track the results of optimization in several search engines at once
If it is important for you to know positions not only in Google, then you already need several reports from different consoles, which will be difficult to configure in one form, since different consoles give different data.
5. Difficult to work with keyword groups
If you have all similar pages grouped into categories by which it is easy to filter pages by URL, then this problem does not concern you.
But often the most valuable pages are from a variety of URLs. In Looker Studio, you can create a separate page with a single filter for all data, where include each such page in the filter. Well, here you will find a limitation. A filter in Looker Studio cannot contain more than ten values.

In position monitoring services, at the stage of uploading keywords, you can specify a group for each word and then look at the general data for the entire cluster.
6. Data delay for one to two days
The Google Search Console provides data with a delay of one to two days. It would seem a trifle. But when you constantly work with the site, update and create pages, then you want to quickly assess whether the page has entered the index and how each of your actions has affected your position in general. I want to see the results of the positions every morning. Position monitoring services solve this problem.
7. You can not measure the percentage of completion of the plan
Above I talked about the metric Average Ideal Final Result. It is a good indicator of the success of your plan, but only within those keywords for which you already have impressions.
If you want to understand how successfully you are fulfilling a ranking plan for a pre-assembled semantic core, then the Google Search Console data will not be enough. You need to track positions for all keywords for which you want to rank, and compare with your results with the Google Search Console.

8. You can not compare yourself with competitors
This is the biggest flaw. When you study your positions with a keyword and see a drop or growth, you want to see what happened to competitors’ websites. You won’t do this in the Google Search Console. And to go and look with your hands the search results for each keyword, geo, type of device is not very convenient.

That’s it. You also can check Google Search Console Looker Studio templates from other authors, that I like.
Additional information
| Data Sources | Google Search Console |
|---|---|
| Custom Dimensions | Ranked Keywords, Ranked Pages |
| Custom Metrics | Lost Clicks, Potential Rank, Ideal Final Result |
| Data Blending | No |