Search Console + Google Analytics 4 for SEO Forecasting
$199
This template helps to blend Google Search Console and Google Analytics 4 data to quickly forecast potential revenue, conversions, and clicks from organic search by landing pages and keywords.
Description
Release updates
Version 2. Updated on June 24, 2024, to align with the last change in GA4: “Conversions are now called key events”.
Version 1. Updated in July 2023 to merge Google Search Console and new Google Analytics 4 (GA4) data.
Version 0. Created in 2020 to merge Universal Analytics and Google Search Console data.
Table of contents
- Why is this report so useful and unique
- How could this be done before
- Who will benefit from the template
- How to blend Google Search Console and Google Analytics 4 data
- Template settings
- How to work with the template
- Frequently asked questions
Why is this report so useful and unique?
The report answers 1 specific question:
How many clicks, conversions, and revenue can a page get if it ranks in first place for all the keywords for which it currently has impressions in Google search and its conversion rate and average order value remains the same as before?
Usually, digital marketers, analysts, and SEO specialists focus on existing traffic and conversions by landing page to judge which page to optimize and improve first.
This is a good tactic, but you should be focused on the FUTURE, not the PAST.
The landing page may have a lot of traffic from organic search, but the main question is how much additional traffic it can get. The same questions for conversions and revenue.
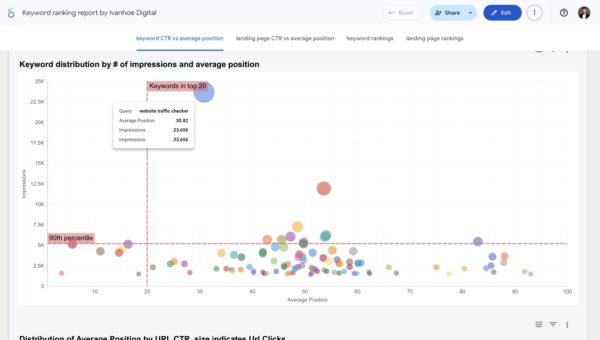
So, the report helps you to sort landing pages and keywords by potential traffic, conversions, and revenue and prioritize your SEO and marketing strategy accordingly.

The limitations and pros of this template
This SEO forecasting report has these limitations.
1. You cannot build a forecast based on an analysis of competitor traffic and keywords that are not yet in your Google Search Console.
This means that if you cover only a small part of search queries in your niche (for example, 10-30%), then you will not see a forecast for the remaining 70-90% in this report.
The template will still be valuable since you will be working on the low-hanging fruit first, but you won’t be satisfied with it alone.
At some point, you will need to use Similarweb, Semrush, or Ahrefs.
2. You can’t quantify how much competition there is for keywords.
To forecast how difficult it will be to get traffic for a keyword, you need to collect some of these metrics, or better yet all of them: cost per click and ad competition in Google Ads, number of unique pages in Google SERP by this query, median number of backlinks that URL from top 10 have, number of feature snippets, etc. Usually, you also need to enrich your existing data with third-party tools.
How it is also important to remember the distinctive advantages of this template.
Tools that can give you data on competition and search volume estimates for each keyword do not have your data on conversions and revenue from GA4. Therefore, you cannot find the most promising pages in them in a few clicks, which you need to work on first.
Therefore, the more content you publish, the more traffic you attract from search, and the more data you accumulate on conversions in GA4, the more value the template will give you.
3 facts to note before using this template for forecasting organic traffic
1. Some pages generate a lot of traffic but no conversions at all.
Working to increase traffic on these pages rarely makes sense.
2. Some pages generate traffic and conversions, but they already occupy the first positions in the search results and there is no potential for traffic growth.
It generally makes sense to work only with conversion optimization on such pages.
3. Some pages have only recently begun to generate their first traffic and it is still unknown how much they actually convert into conversions.
These pages must have intermediate conversions set up such as creating an account, going to the checkout, etc., so that you quickly notice their potential.
How could blending GSC and GA data be done before?
As previously, it was possible to solve this problem:
- It was necessary to upload data from the Google Search Console to Google Sheets directly or using this Chrome extension.
- In the other tab of the table, upload the necessary data from Google Analytics directly or using Google Reporting API.
- Merge data in a table using the VLOOKUP formula.
- Add a couple of formulas and run them across all pages and keywords.
- Do it every time again for a new period, since the data is static.
An experienced user can do this in 5-10 minutes for one site. But if you need to do this every week, month, and for more than one site, then the time spent on such routine operations becomes noticeable.
How can this problem be solved now:
Now you don’t have to do anything. In 2 clicks you are available all the necessary data that is updated in real-time. But the report has certain limitations.
Who will benefit from the template?
The report will be useful if several conditions are met.
1. You have correctly configured e-commerce and/or key events tracking in Google Analytics 4.
As practice shows, few people have set up e-commerce. But if you have it configured, then check that you have no zeros by such metrics: Transactions, Purchase Revenue, Average Purchase Revenue, and Purchaser Conversion.
If you haven’t configured e-commerce tracking, you can use tracking key events. In this case, it is important that:
- You track key events of similar types: filling out the purchase form, registering, clicking on the affiliate link, clicking on the Buy button, and visiting the payment confirmation page. Sometimes people combine different types of conversions, for example, buying, spending on the site for more than 3 minutes, viewing more than 5 pages, and subscribing to email newsletters.
- You are sending the Event Value (note! not Event Revenue) parameter for all key events you track.
3. You already have accumulated data on traffic, sales, and revenue, which allows you to build forecasts for potential revenue for the page, and keyword.
In my Looker Studio report, we calculate the potential revenue for the page, and keyword, based on the data on key events, and the average order value for the past period.
If you just set up key events tracking or e-commerce, you will need to wait some time for the data to collect. What exactly is this period, depends heavily on your weekly traffic and key events.
How to merge Google Search Console and Google Analytics 4 data?
This is the step-by-step guide on what to do if you want to generate a similar report.
1. Connect Google Analytics as a data source and add a new field there.

2. Write down the field formula and save it.

If all your website URLs end with a slash.
concat(“https://”,Hostname,Landing Page, “/”)
If all your website URLs end without a slash.
concat(“https://”,Hostname,Landing Page)
This formula is needed because the Landing Page parameter is presented differently in the Google Search Console and Google Analytics 4.
If your site is hosted on the HTTP protocol, then change the formula as well. It’s also important that the Google Analytics 4 property shows data for only one domain. If you set up cross-domain tracking within, you won’t be able to combine data with the Google Search Console within that property. This is possible only if you set up subdomain settings in the Search Console property too.
3. Connect Google Search Console as a data source
Use URL impression table and web search type. If you will use another setting the template won’t work.

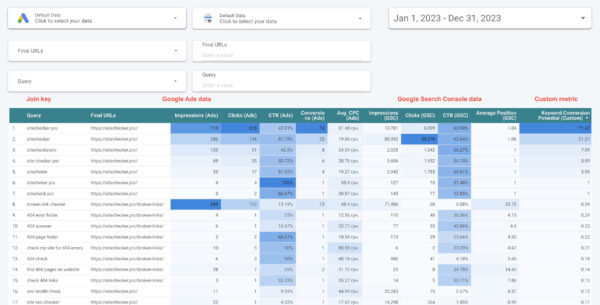
4. Click Blend data and add only parameters and metrics you will use in the report
Use the screenshot below to find out which metrics and parameters to include. Note that in Google Analytics 4 data source you should use the custom field Full Landing Page that you created on the 2nd step.

5. Set up Left outer join condition
Choose the Left outer condition and add fields that will be used as a key to blend data: Landing Page from Search Console and custom field Full Landing Page from Google Analytics 4.

Next, connect the automatically created dataset to all filters, create calculated metrics, and play with the data as you like. But here there is one more nuance.
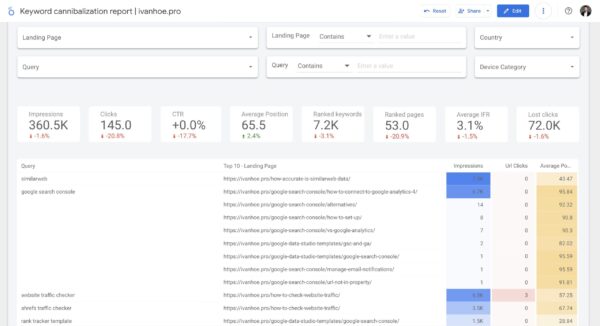
How the report works
Important nuance
The caveat is that you need 2 separate blended datasets to use the report to the maximum. One dataset includes a Query parameter, and the second does not.
You need 2 datasets because when you apply a query filter to GSC data, you will lose a lot of data by impressions and clicks, so you won’t have the correct picture of how many clicks you got to your landing page. That is why I’ve created 2 datasets and applied a dataset that includes the Query parameter only to the second table where queries are located.
Below is the screenshot from the Search Console Help that gives more details about this issue.

All report elements, except the second table, are connected to the dataset without a Query parameter so that you can view more data. Now a little more about how the report is arranged.
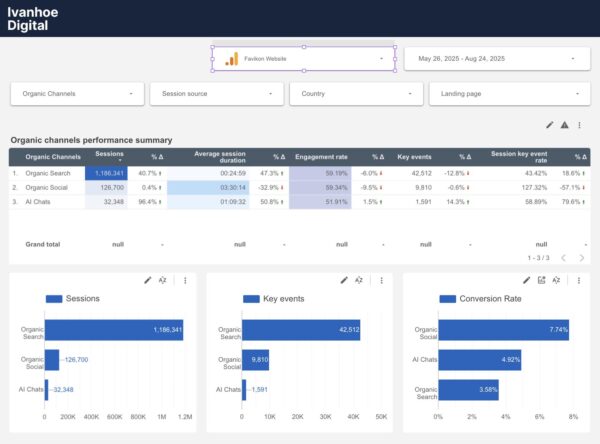
Two pages
The first page is designed to work with data based on tracking key events, and the second – is based on working with e-commerce. When creating our own metrics, we use different metrics with Google Analytics 4. Some for the Key events, others for the Purchases. Therefore, such a division into 2 pages is necessary.

Three groups of metrics
The report has 3 groups of metrics: Google Analytics 4 metrics, Google Search Console metrics, and calculated metrics, which we form based on the first two.
I specifically did not change the labels of Google Analytics 4 and Google Search Console metrics in tables and cards, so you can easily compare their values with the original source.
Click on the picture to see the inscriptions.

Calculated metric formulas
Formulas for key events view.
Lost Сlicks
(Impressions * 0.2) – Url Clicks
Lost Key Events
((Impressions * 0.2) – Url Clicks) * Session key event rate
Lost Revenue
((Impressions * 0.2 – Url Clicks) * Session key event rate * (Event value/Key events))
Formulas for e-commerce view.
Lost Clicks
(Impressions * 0.2) – Url Clicks
Lost Purchases
((Impressions * 0.2) – Url Clicks) * sessionKeyEventRate:purchase
Lost Revenue
((Impressions * 0.2) – Url Clicks) * sessionKeyEventRate:purchase * Average purchase revenue
How to work with the template
Basic
You just save yourself a link to the report and use it, choosing your properties using connectors in the heading, without changing anything in the structure. I keep all reports on my site, under the heading of Looker Studio templates. If you need to quickly find the report you want, you can return to this page, everything is well structured there.

Advanced
You copy the report to yourself and then you can experiment with it as you like.
Click Сopy report in the upper right. Connect the Google Search Console and Google Analytics 4 of the same site.

Also, do not forget that you can easily download the generated tables in Excel or Google Sheets and prescribe for yourself opposite each page, a keyword, what actions should be done on it to increase positions.

Frequently asked questions
1. Why do I have slightly different data in Google Analytics and in the report?
You really may have a small margin of error in the data. However this is not related to any problems of data aggregation when combining GA and GSC.
For the test, I specifically made 2 tables with one Google Analytics source. In the first table, the default Landing Page parameter was displayed, and in the second, the parameter is already based on the formula where the domain is visible.
Although the data should be identical, there really is a minimal error. The reason is unknown to me. But with such an error, the report does not lose value. If you have a much larger error, write to me about this issue.

2. What if I don’t have conversion and revenue data?
The first is to configure them as quickly as possible. Secondly, while this data is being collected, you can add your conversion and average order value to the formulas. They can be found somewhere from competitors, in market research, or predicted based on your experience
3. Is it possible to extrapolate page conversion to keyword conversion?
Yes, keyword conversions on a single page can vary greatly. Especially problematic if you have a strong page and it is ranked by high-volume irrelevant keywords that are unlikely to bring sales. But there’s nowhere to get keyword conversion data from organic search.
Therefore, we can either extrapolate in this way or conduct companies in Google Ads in parallel and take keywords conversions from there. But this will also not be the best option since traffic in organic and commerce can be very different.
Additional information
| Data Sources | Google Analytics 4, Google Search Console |
|---|---|
| Custom Dimensions | Full Landing Page |
| Custom Metrics | Lost Clicks, Lost Key Events, Lost Revenue |
| Conversions | Key Events |
| Data Blending | Yes |